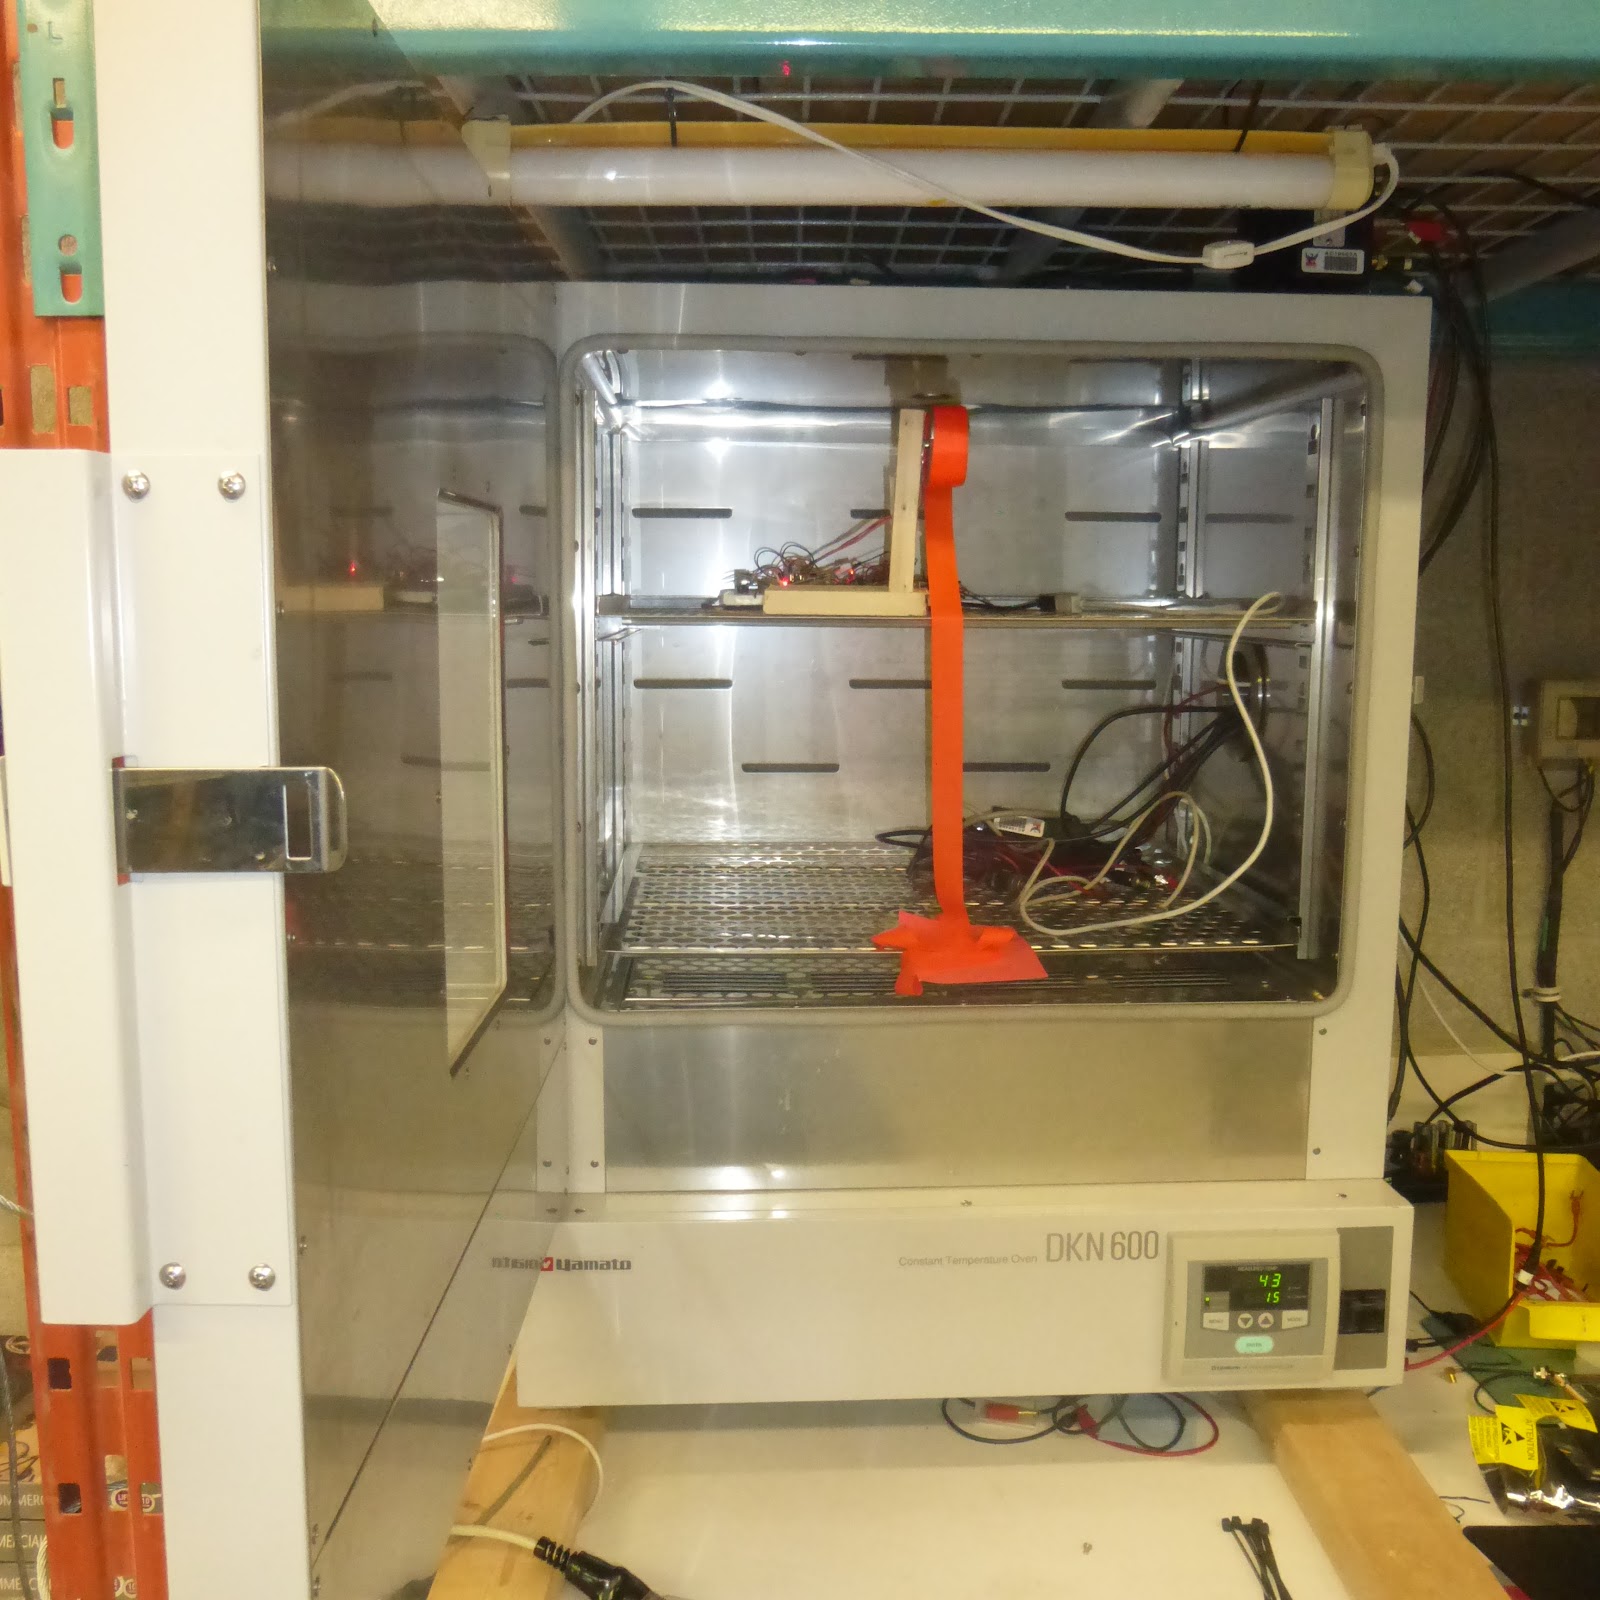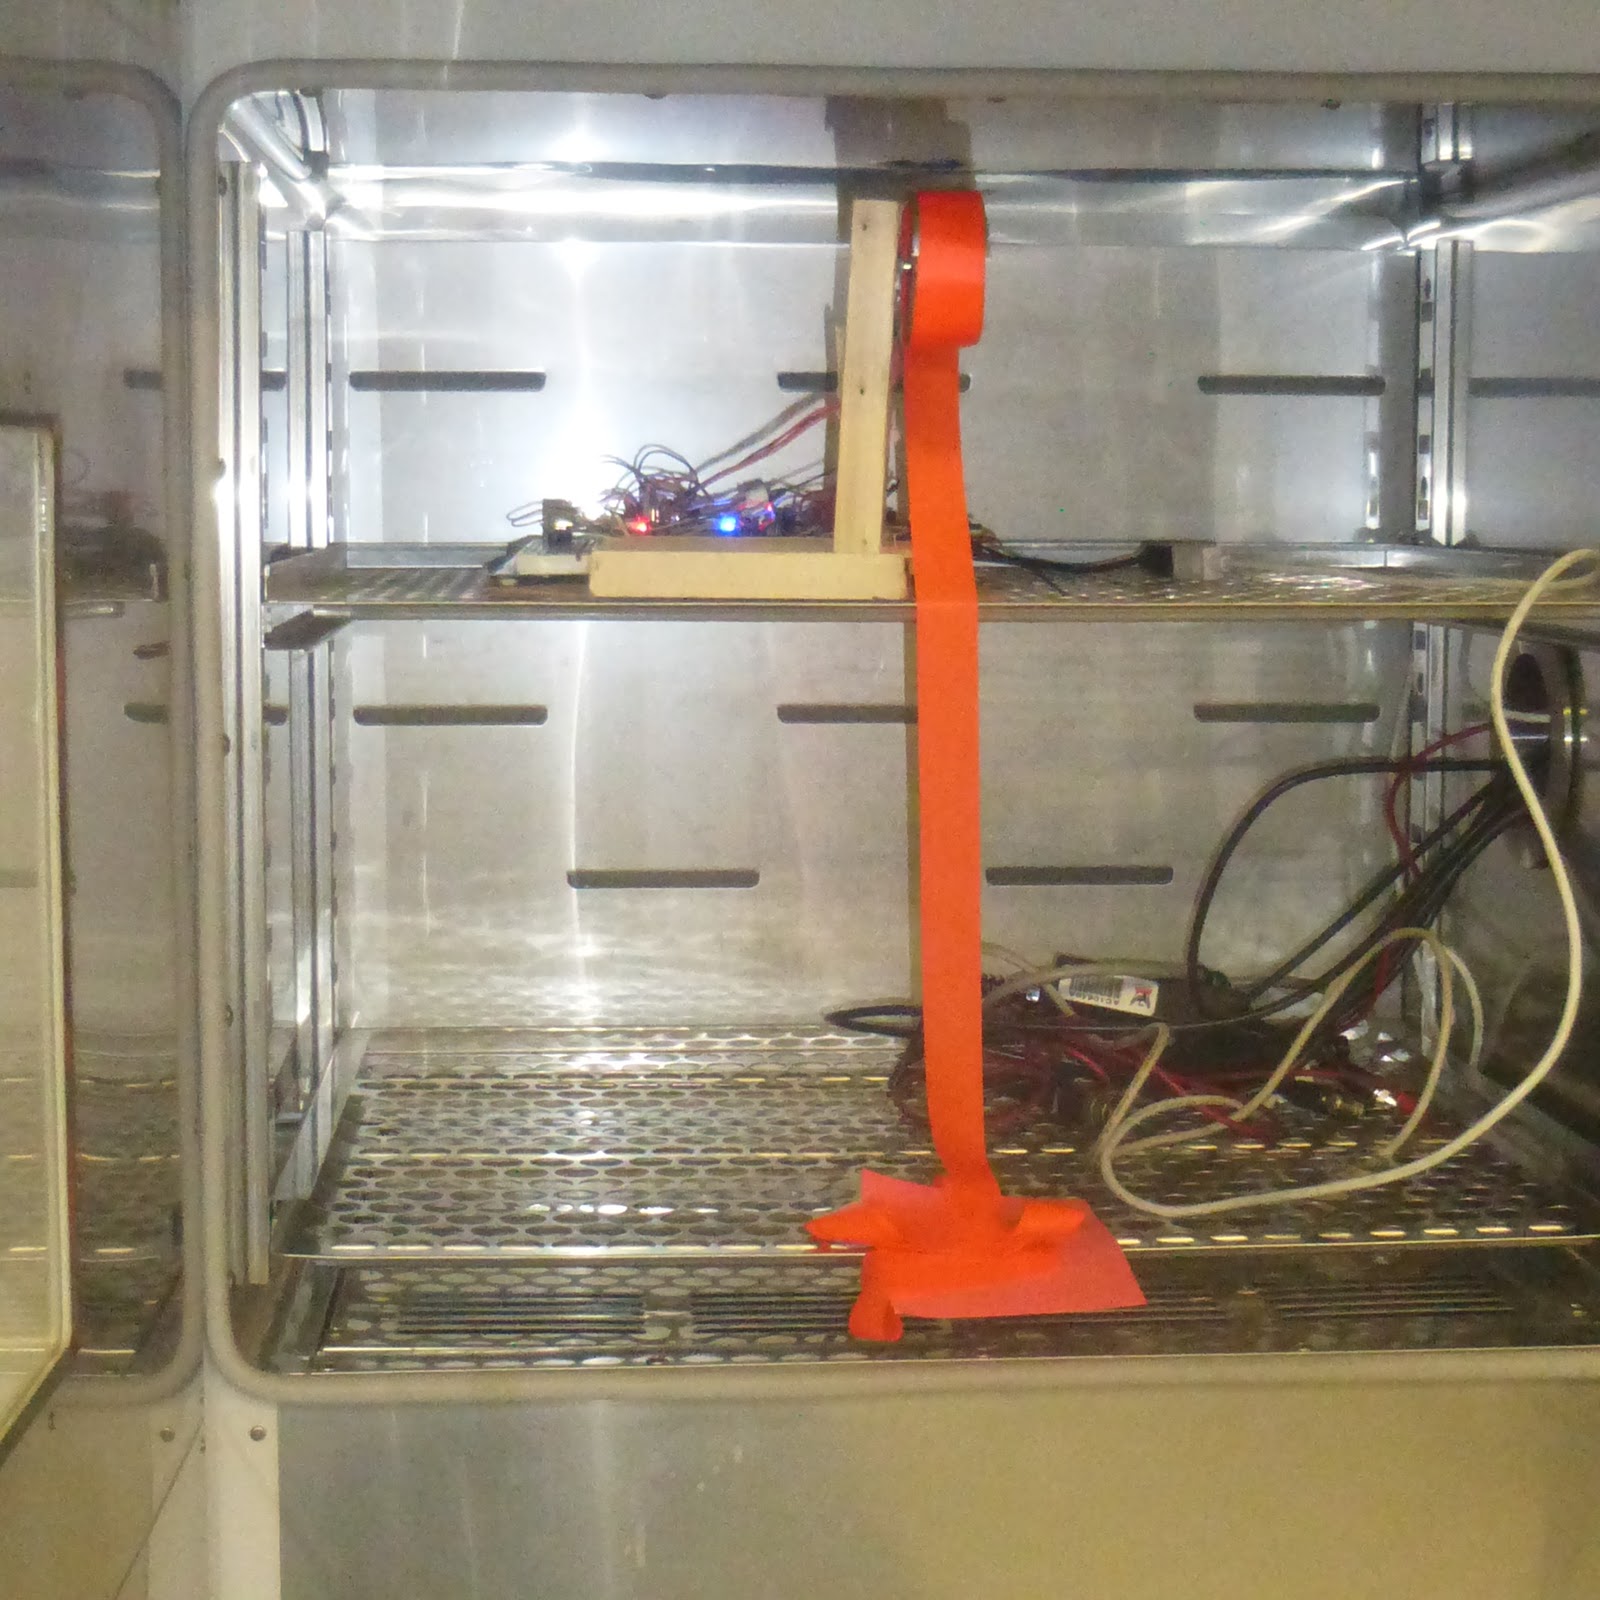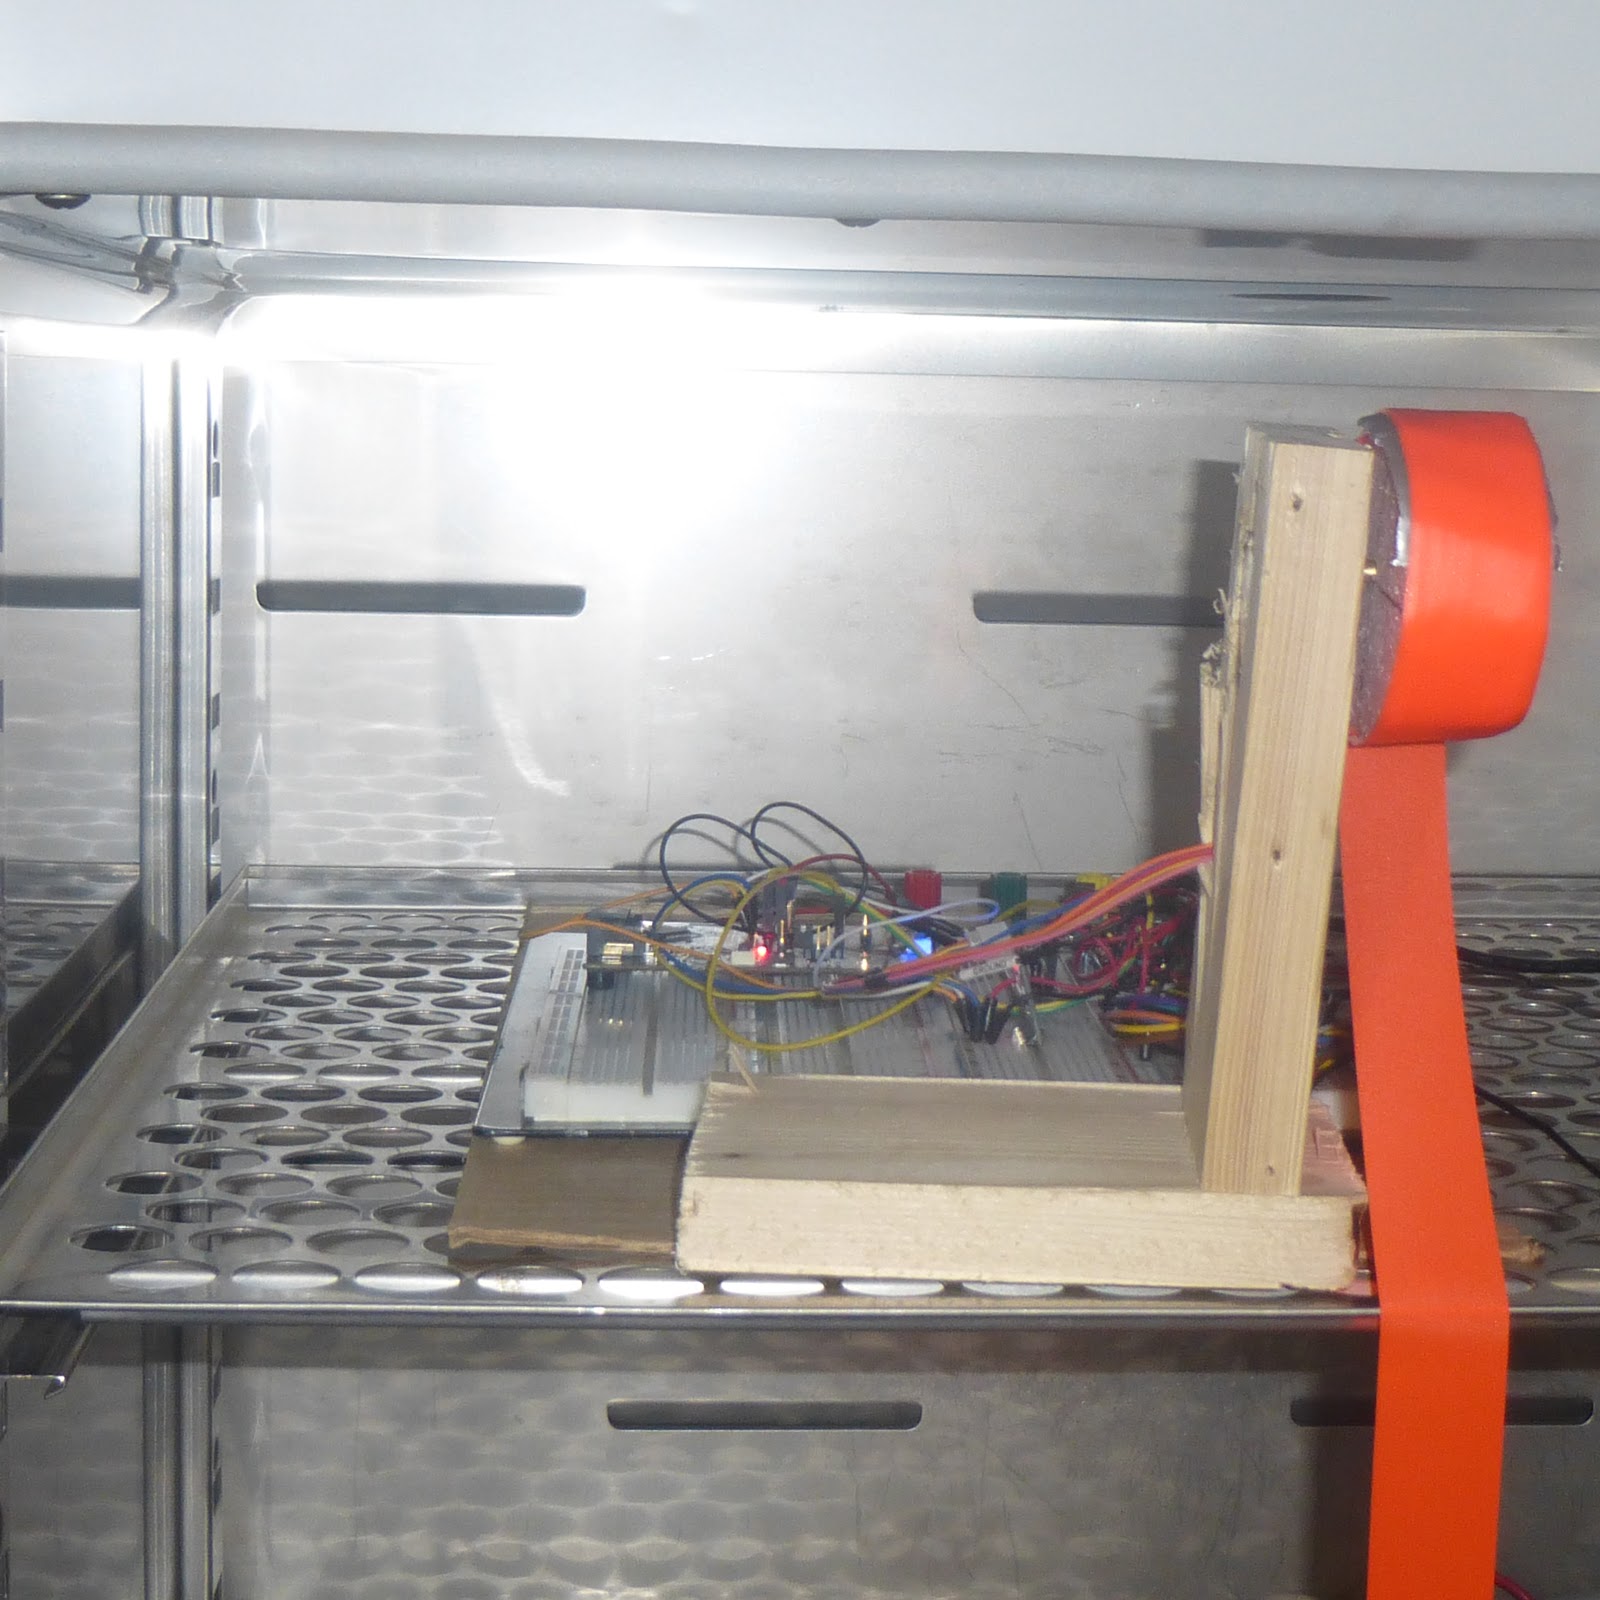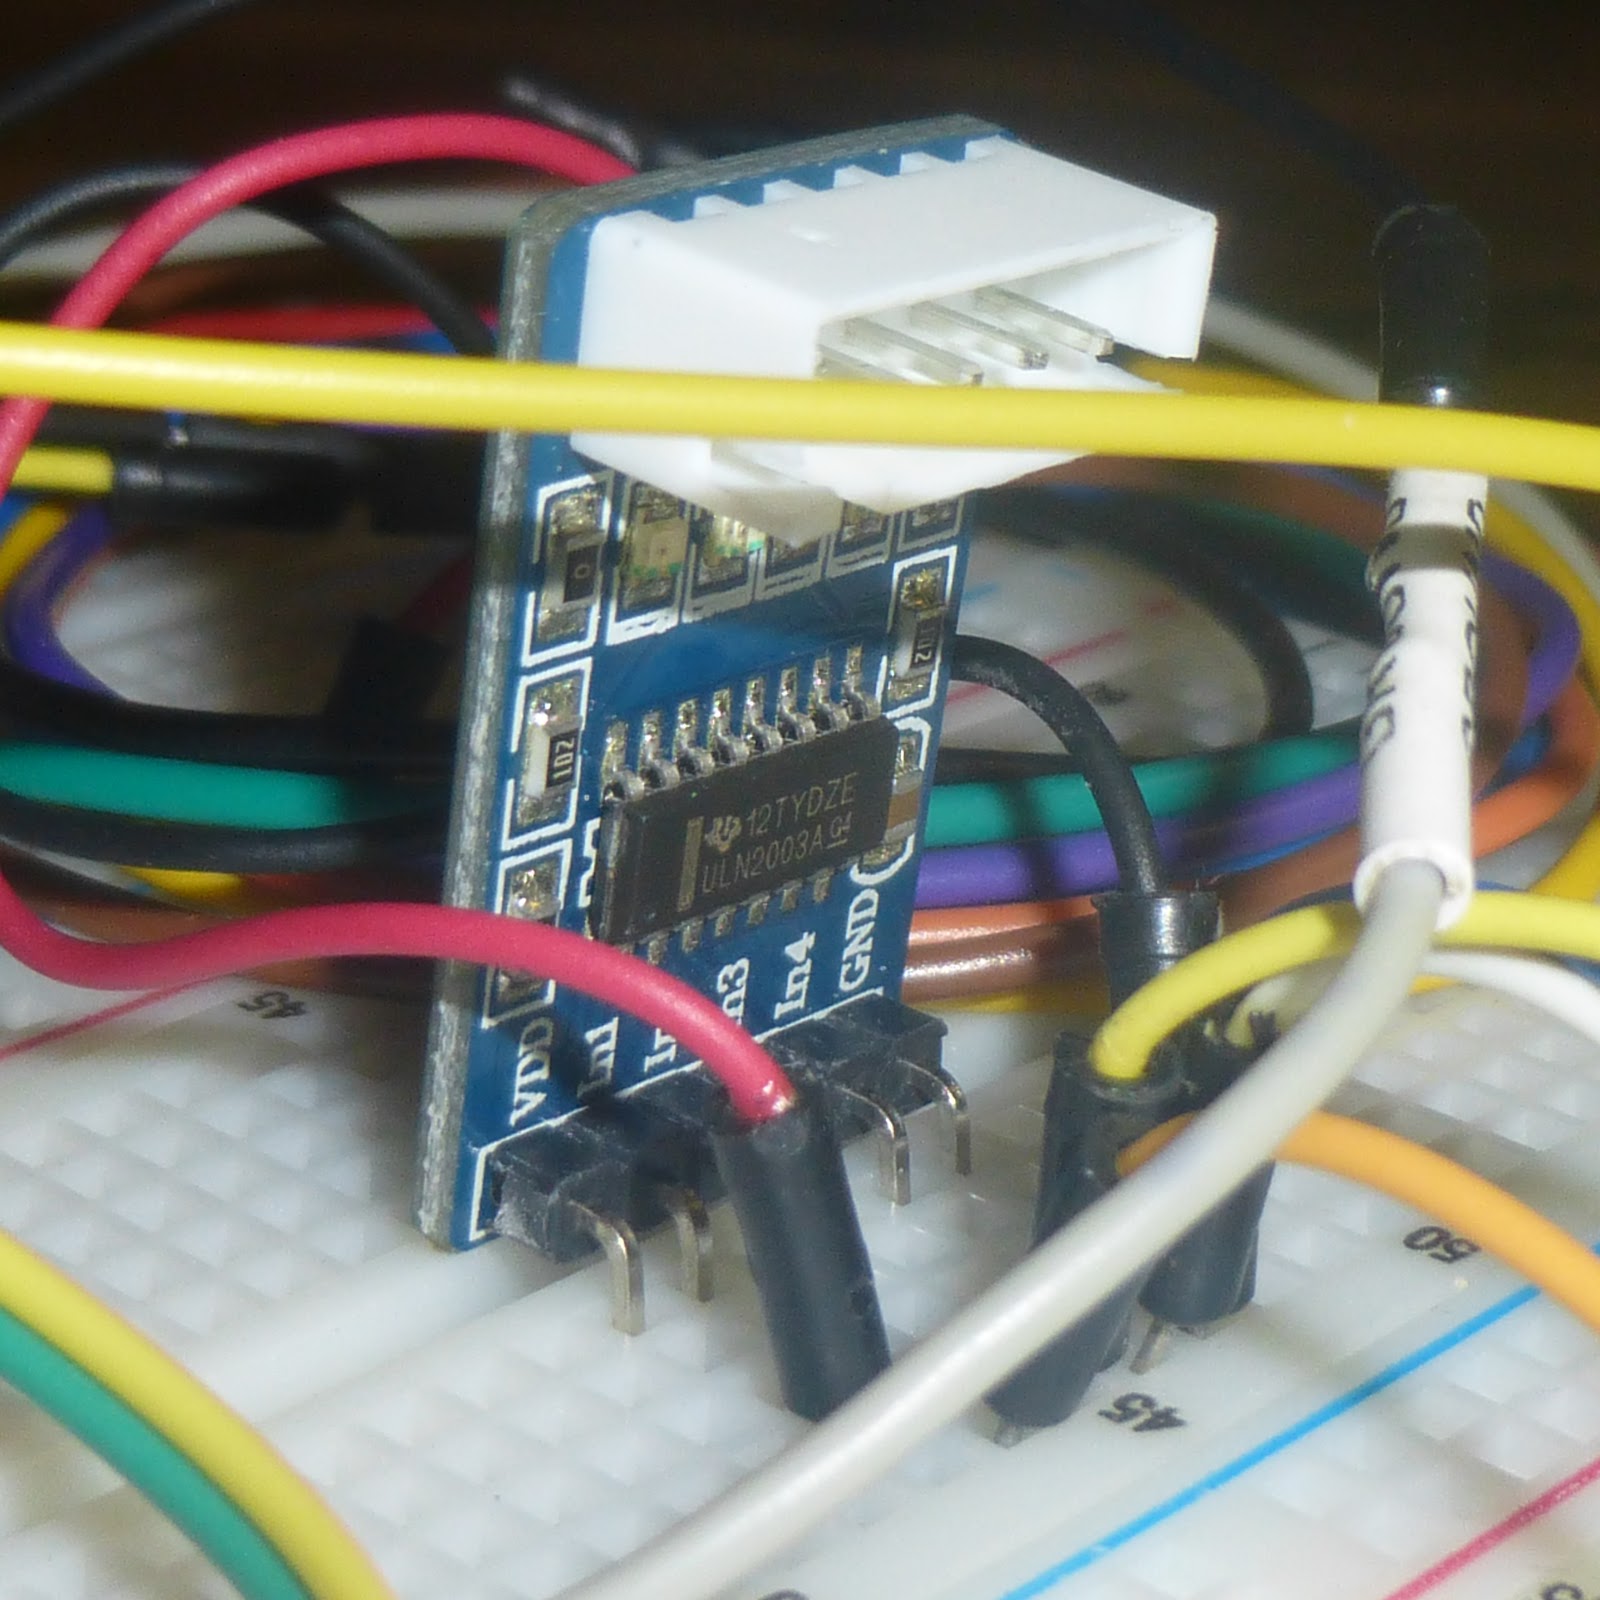
I would like to thank Amphenol and Element14 for giving me the opportunity to review this set of sensors. Having spent the last year or so working with two environmental sensor systems I wanted to see how Amphenol’s solution compared. My initial proposal was to test Amphenol's solution in an environmental chamber where I would be able to test the system in a controlled and calibrated environment. Unfortunately this was not possible due to unforeseen circumstances.
Having tested the other two systems, a LiVPi - intended for indoor sensing as well as a AirVisual Node - intended for both indoor and outdoor sensing, I decided to use these as pseudo calibrated units. All three units (the LiVPi, AirVisual Node and Amphenol’s solution) have temperature, humidity and CO2 sensors. Beyond this they differ in that the LiVPi also reports pressure, the AirVisual Node Reports P2.5 concentrations (and P10.0 but only via file access) and the Amphenol solution provides dust concentrations of various particle sizes.
With the increase in air quality awareness there has been an explosion in companies providing sensors as well as in the range of sensors available. The issue then becomes how to know the quality and reliability of each of these sensors. Unlike temperature or humidity, CO2 and dust concentrations are not things we grow up paying attention too and become innately aware of. This makes understanding as well as knowing when a sensor is reading correctly is a lot more difficult.
I have therefore taken a multi staged approach to reviewing these sensors. Firstly I would like to see how robust they are. Being environmental sensors I would like to see how they live up to the environment they should be able to sense. Secondly I would like to see how well they agree with other sensors, both calibrated and not calibrated. Lastly and because this kit is specifically designed for testing the sensors to then be used in a standalone product, how easy is it to understand their documentation and subsequently use them.
Robustness
Sensors that are meant to sample and test their environment should be able to withstand that environment with no issues. One way to be sure they can survive is to push the boundaries and see how they react.
Using a rural environment that is open to the sun and wind (sheltered from rain) I decided to leave the unit outdoors for two weeks along with my other two units. The idea behind this was to see how the sensors would behave as well as test the ABC logic of the CO2 sensor. I also wanted to see if there would be any effect on the readings of the sensors while exposed to the elements.
The first and most noticeable environmental element that the sensors needed to deal with was the wind and more specifically the sand. Being only a few tens of meters from the beach the wind can be quite vigorous (sustained 23 km/h, gusting to over 31 km/h). I was quite impressed that even through this the sensors carried on working with no issues. While the temperature and humidity sensor is IP67 rated the others are not. As can be seen in the picture below, after two weeks the board and sensors are well covered in sand.
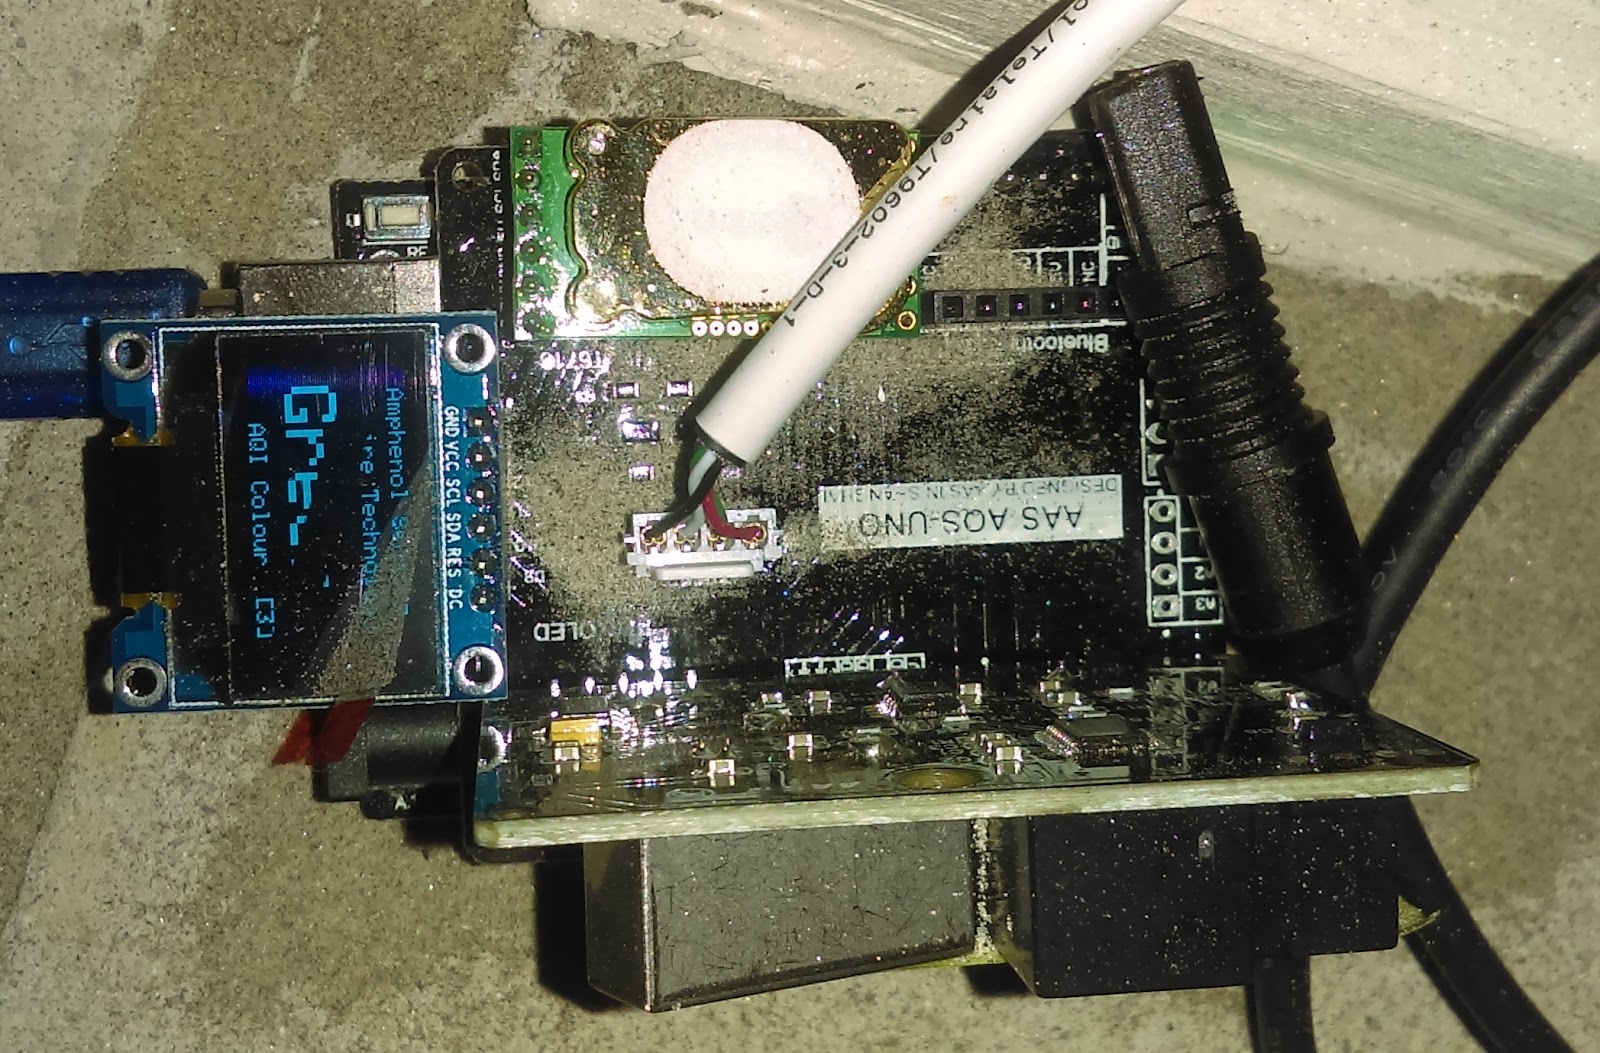
Amphenol sensor kit covered in sand after 2 weeks of outdoor testing
An interesting point, whether designed as such or not the dust sensor, while adequately sensing dust conditions did not get sand in the sensor. This was verified both by looking inside the sensor after removal of the cover tape and inspection of said tape. It should be noted that while the sensor was not pointed into the wind but, was approximately parallel to it, the area where the sensor was sheltered has vortexes and as such sand could have gotten into the openings. The CO2 sensor had no issue due to the air permeable covering over the sensors opening.

Tape used to cover the mirror cleaning port with no viable sand on the inside section
Along with the wind there was rain and often enough driving rain. Together the wind and rain made quite a formidable duo. Fortunately the sensors remained dry for the most part. There were some rain drops that landed on the CO2 sensor but again there was no adverse effects. While not waterproof or even rated as water resistant, the air permeable cover worked well at keeping the few raindrops that did land on the sensor out.
Throughout the full two weeks the sensor array had no issue at all. The CO2 sensor was quick to acclimatize and start producing agreeable readings. The temperature sensor was the closest to the actual temperature of the three sensors placed. Even with direct sunlight on the sensor the Amphenol sensor maintained the lowest overall reading. I would like to note an issue with the temperature/humidity sensor that was received. The air permeable membrane on the one side appears slightly removed potentially allowing for water and other particles to enter.
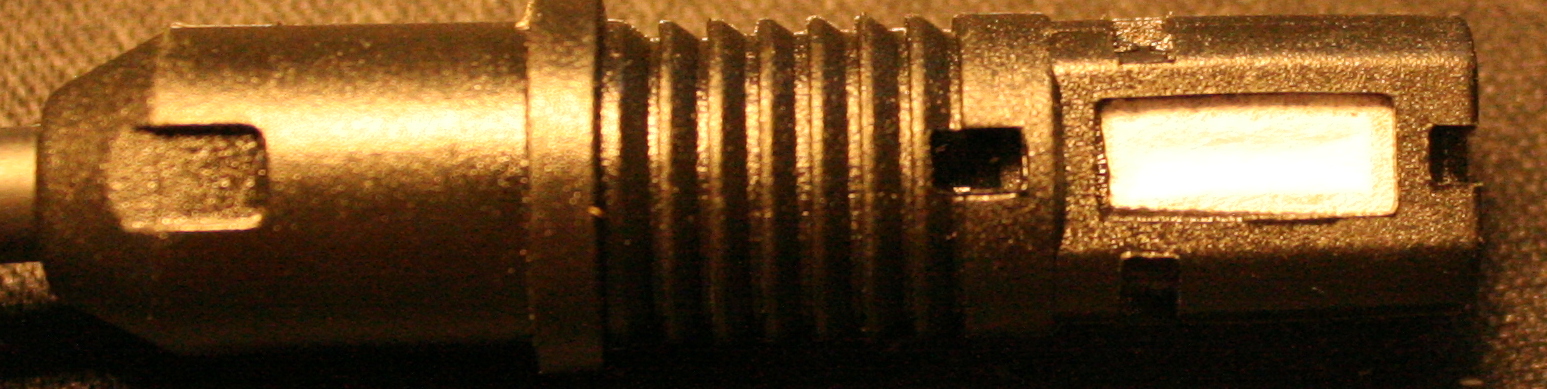
T9602-3-D-1 with cover properly covering air opening
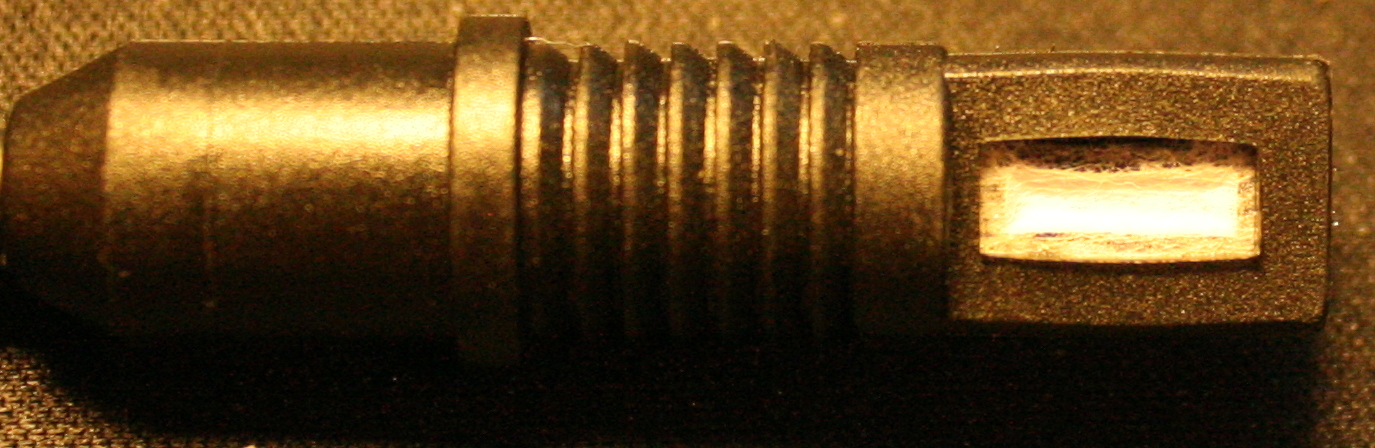
T9602-3-D-1 with cover not properly covering air opening
Agreement between sensors
Having two other sensor kits that have been tested in a calibrated environment I though this may be a valid and useful way to test the Amphenol sensors. Unfortunately I did not have a method setup during this period to log the data from the three systems. This is something that is currently being worked on and will hopefully be set up shortly with a publicly accessible web interface where others can see and compare the data between the systems.
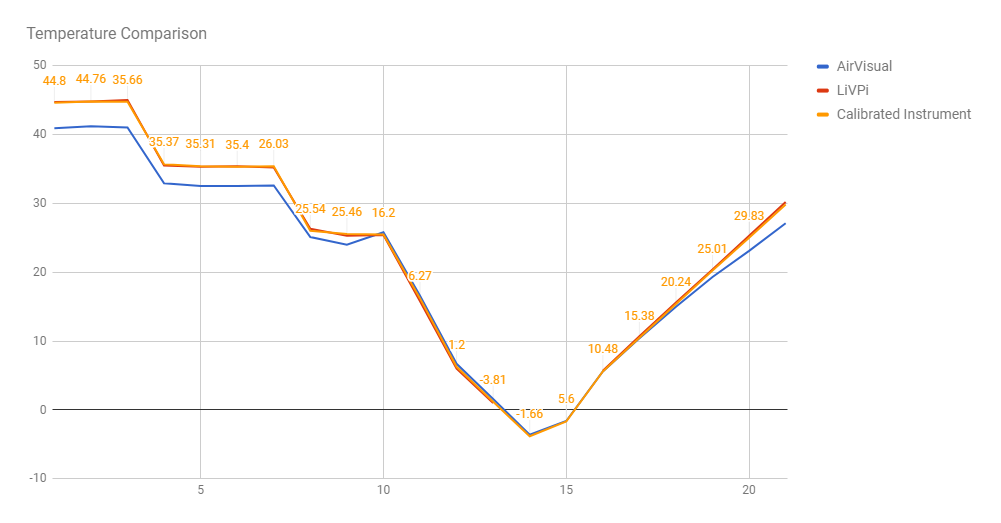
Temperature results from testing the LiVPi and AirVisual against a calibrated instrument
Testing was therefore conducted using visual checks at random times. With the exception of external heating (due to direct sunlight) the largest temperature reading spread was approximately 2 ℃. While this does not confirm the reading of the T9602-3-D-1 is calibrated within ∓ 0.5 ℃, it at least shows it's very close.
While the temperature measurements have been very close the same cannot be said for the other sensors. The humidity measurements have been as far as 10% apart with this being predominantly noticed with the AirVisual Node. The measurements between the LiVPi and the T9602-3-D-1 have been closer with variations usually under 5%. From the calibrated test results it can be seen that the LiVPi does have a curve closer to the real values. This would imply that the T9602-3-D-1 is again pretty close to if not at its stated accuracy.
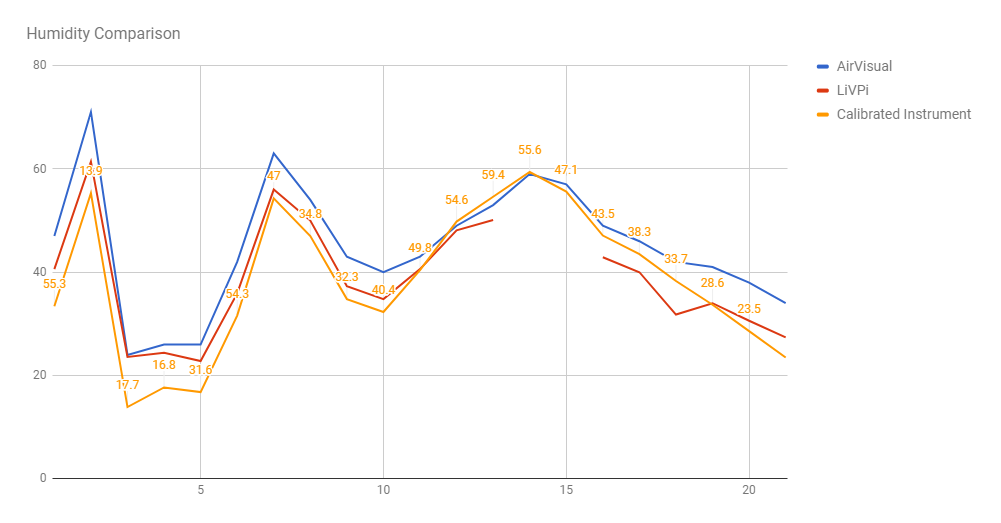
Humidity results from testing the LiVPi and AirVisual against a calibrated instrument
The last sensor that could be checked in a direct comparison with other sensors was the CO2 sensor (T6713-6H). Of the sensors this is the first that we have no innate understanding of. For this reason this is the first measurement that there is complete reliance on sensors. The spread between the three different sensors was very large. Unfortunately in this case Amphenol solution was the outlier. In outdoor test both the LiVPi and the AirVisual Node were measuring around 400 ppm, which is normal background CO2 levels. In the same environment the T6713-6H was measuring ~350 ppm which depending how you look at it could be pushing the “±30 ppm ±3% of reading” specification. In an office environment the three sensors have been seen measuring: 1485 ppm - T6713-6H, 1241 - LiVPi and 1197 - AirVisual Node. In this case the Amphenol solution is way past its accuracy in comparison with the other two sensors. While this is not definitive and definitely allows for determining basic air quality it leaves the stated accuracy in a bit of question.

Amphenol’s T6713-6H CO2 sensor solution

Senseair K30 CO2 sensor solution
It should be noted that in comparison with the LiVPi sensor (Senseair CO2 Engine K30) the T6713-6H is much more compact and product friendly. Due to its smaller size it would be a lot simpler to incorporate in end user products. The ability to use I2C and UART also allows for easier incorporation. The T6713-6H does have a smaller input voltage range (4.5V ~ 5.5V) in comparison to the Senseair solution (4.5V ~ 14V) which can affect where or how it is incorporated in products.
The last sensor included is the SM-PWM-01C dust sensor. While no direct sensor or calibrated source to test with, the AirVisual Node’s P2.5/P10 sensor was used as a semi comparison. During the three tests that were conducted mixed results were obtained as will be explained. The first test was using smoke. Newspaper was burned in a low oxygen environment causing lots of smoke to be produced.

Initial test setup using smoke
Unfortunately in the above setup the dust sensor would not register any particles. The setup was then changed to have the sensor down wind from the smoke, at this point the sensor started to register a somewhat elevated particle count. This was not at all encouraging as one of the stated uses is smoke detection. In contrast the AirVisual Node which was upwind from the smoke immediately registered elevated levels. This can be seen in the images below
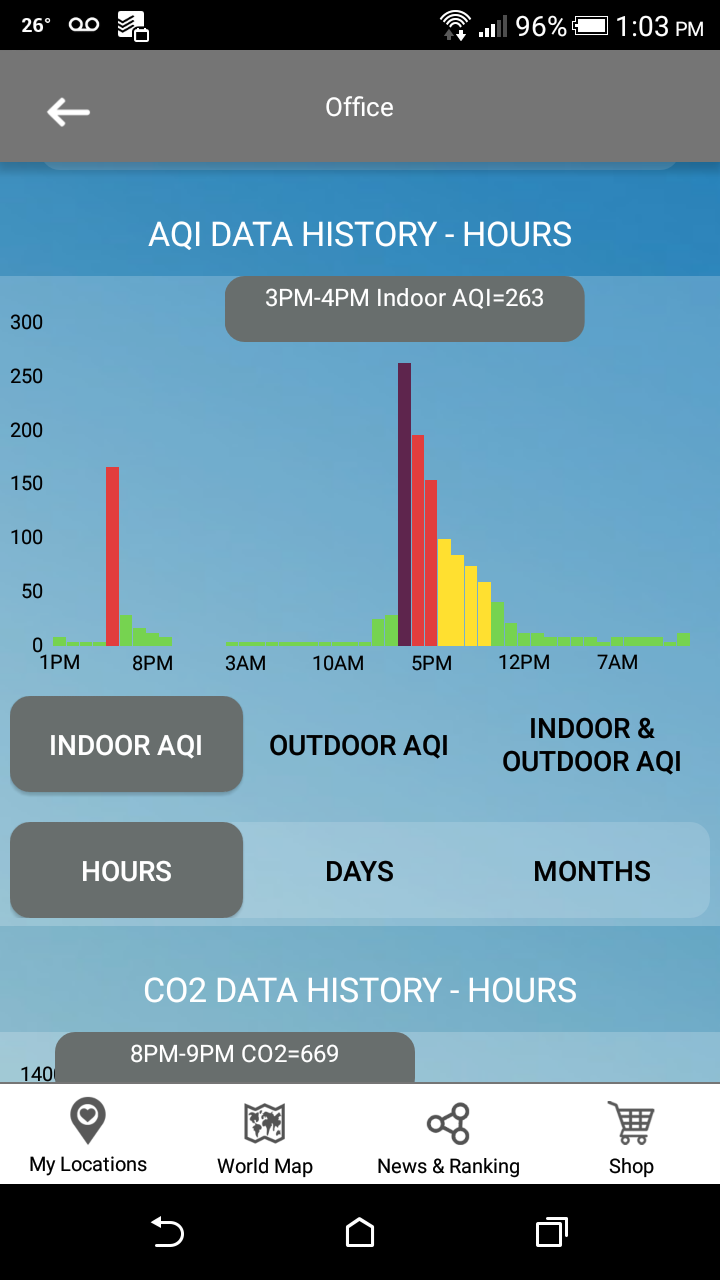
Levels before and after testing using smoke
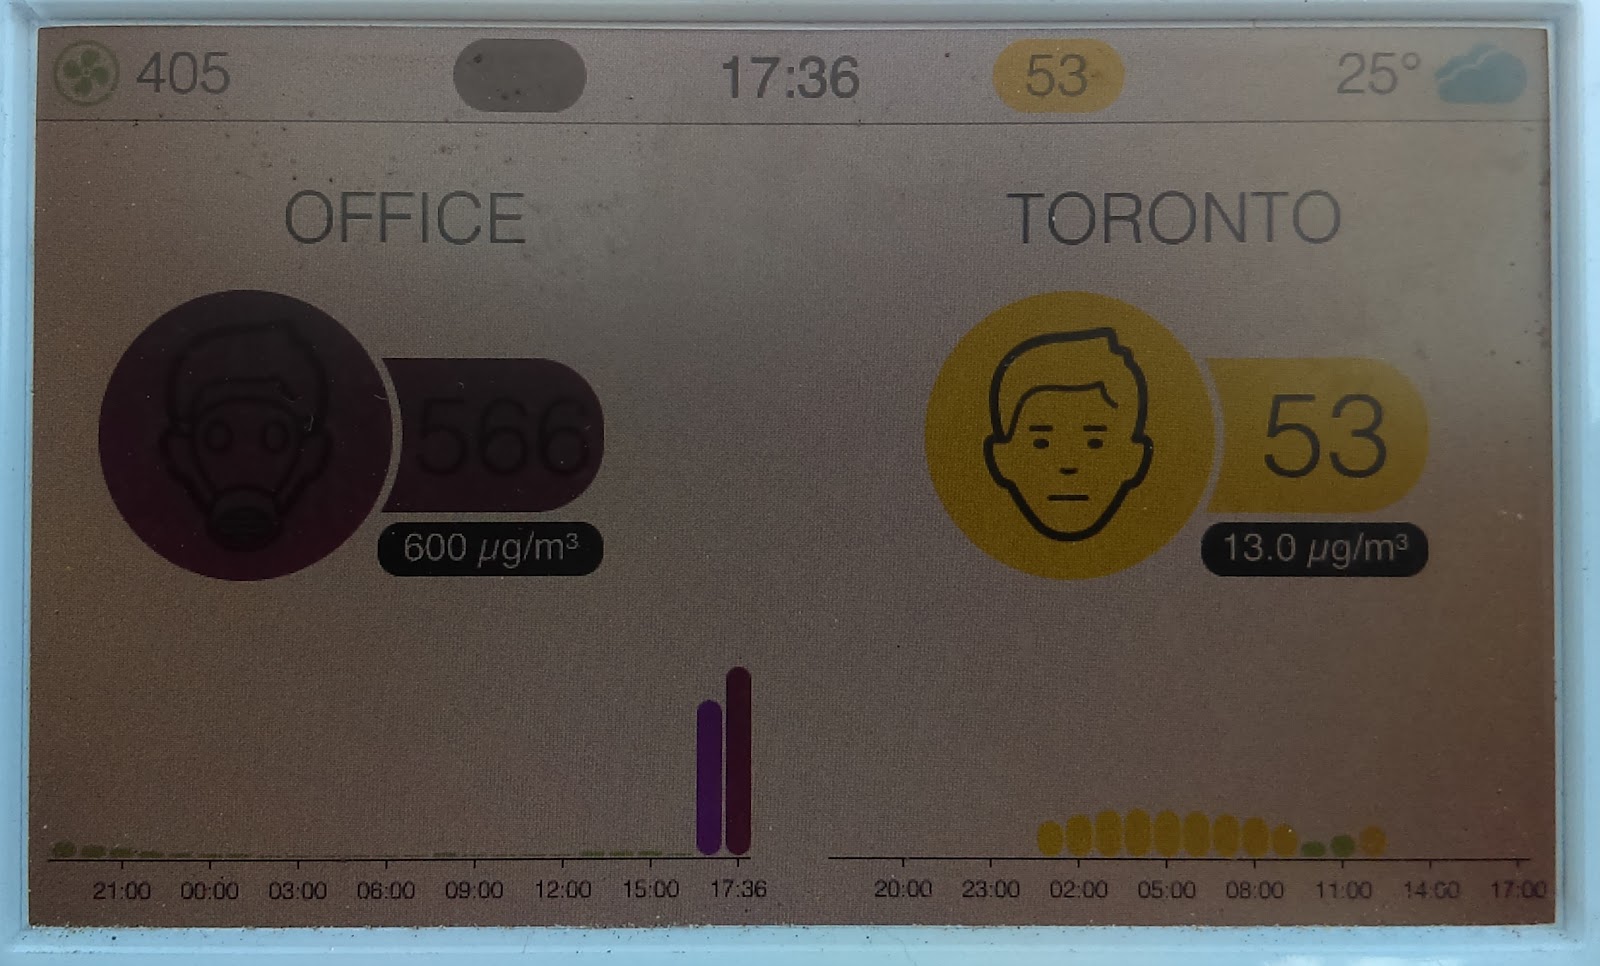
AirVisual’s display clearly indicating extremely elevated levels of fine particles
It should be noted that it was later discovered that the covering to the mirror cleaning port was not in place. While the bad measurement quality may be attributed to this, I believe the levels measured should have been elevated if even only slightly. This belief is taken from the levels of both P2.5 and P10 measured by the AirVisual Node. At those extremely high levels something should have registered if even only slightly.
The next test, done by accident was a cooking test. Frying oil produces a lot of very fine smoke. While this may have a noticeable odor it is not very visible. In this case the dust sensor did register a “Yellow” condition. These two test left the sensor in a limbo regarding its reliability. A third test was therefore conducted.
The last test performed was with sifting flour in a room with airflow produced using a ceiling fan. In this case the results were again mixed. While sifting the flour through a very fine sieve no elevated dust levels were registered. To be sure enough dust was produced, the dusting went on for more than 30 seconds and relatively close to the sensor. This left a fine white coating of the testing area and sensor kit.
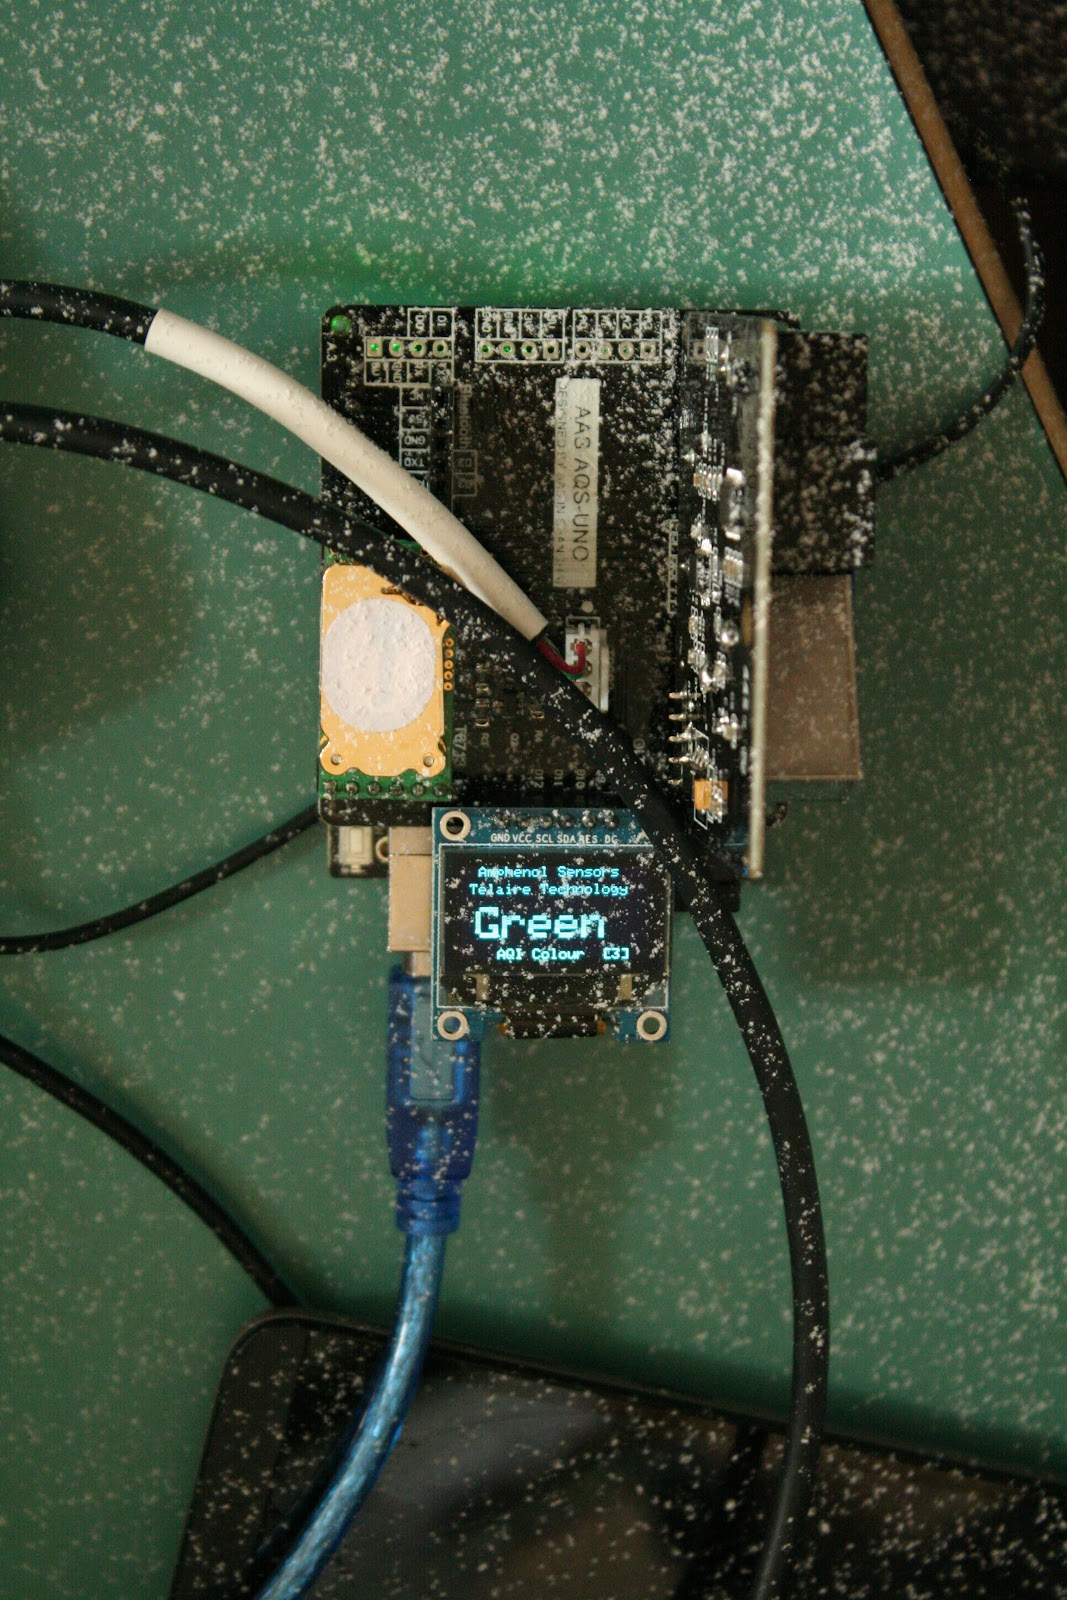
T6713-6H being tested with flour
When this test was thought to be completed and the sensor to have failed, an air compressor was used to blow the flour away. This was when the sensor started to register elevated levels. The sensor quickly registered levels as high at 40 (ug/m3, units unclear).
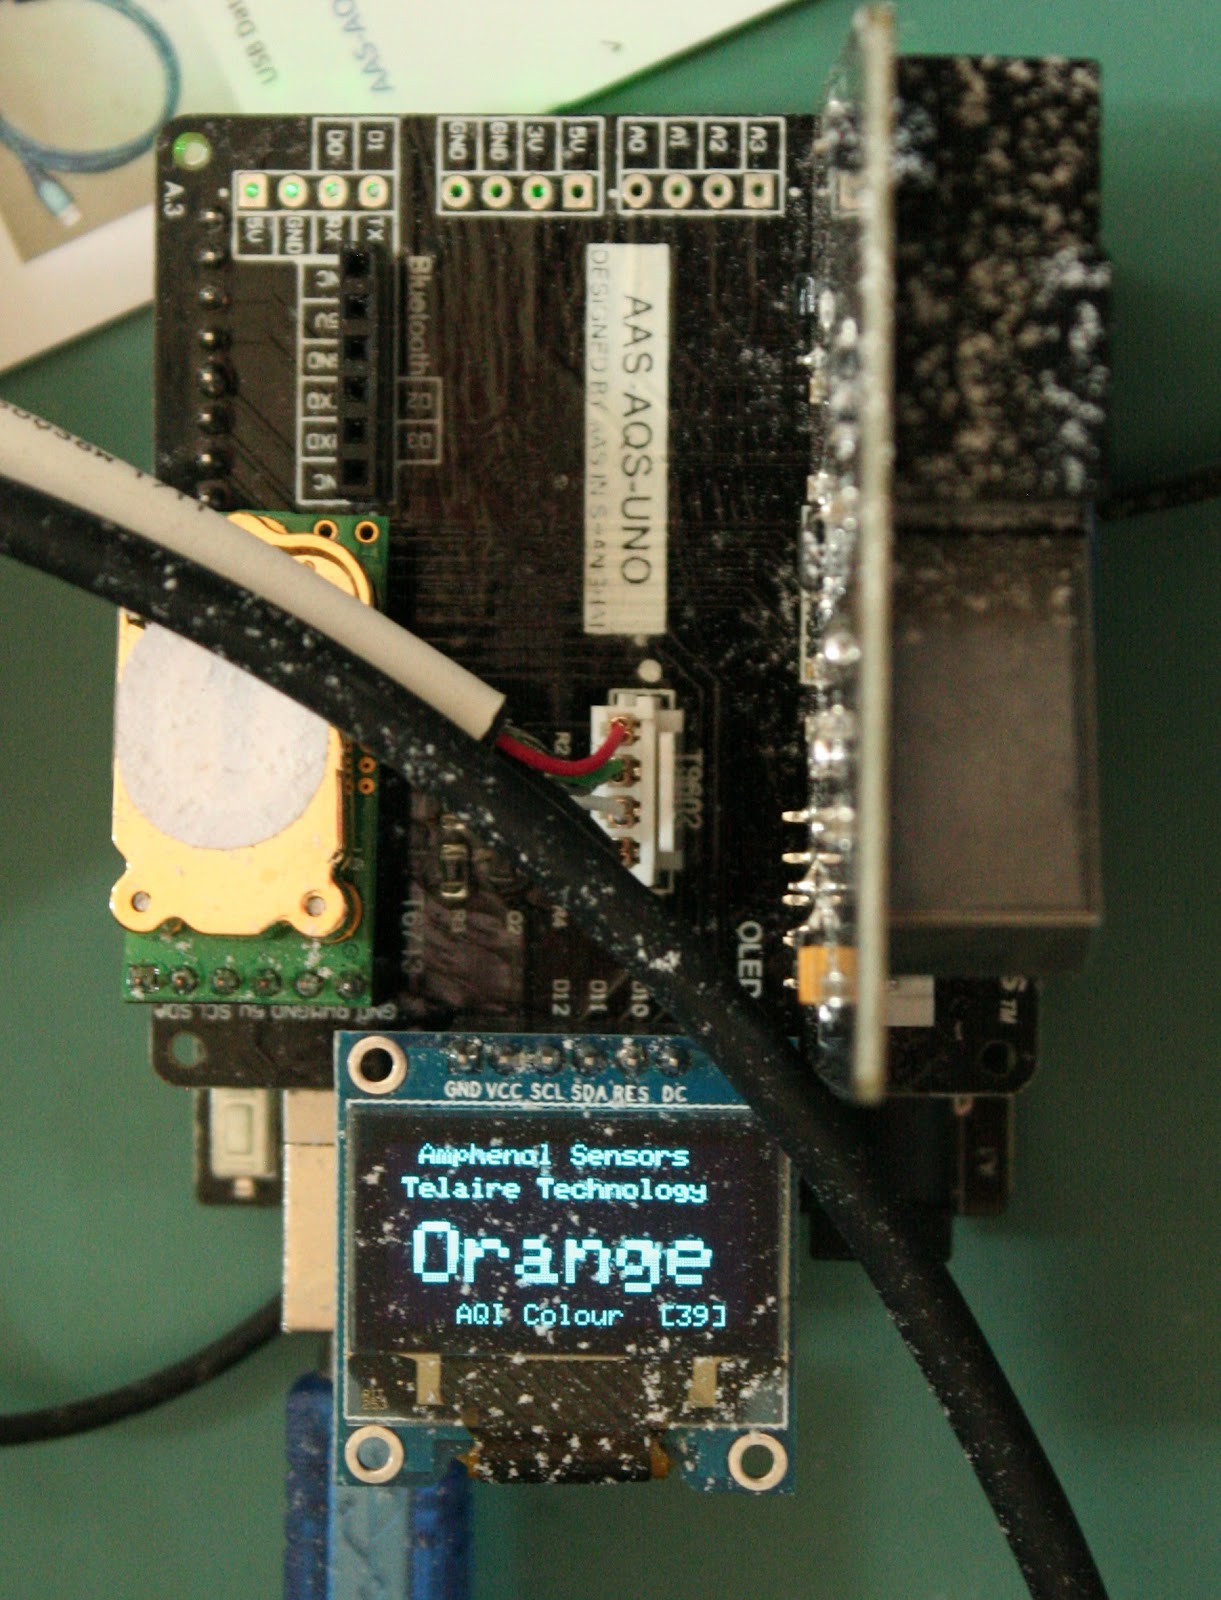
T6713-6H detecting fine flour being blown with an air compressor
Overall this left me wondering about the specifications of this sensor as well as its intended uses. Perhaps better airflow should be recommended or range of particle size detection better explained. Either way, this sensor did provide some usefulness detecting fine smoke (frying with oil) as well as fine flour but not seemingly larger smoke or flour particles.
Documentation and easy of use
This kit and the sensors in the kit are provided in such away as to allow developers to test them and learn how to incorporate them into new products. In order for this to be successfully achieved accurate, reliable and understandable documentation is required. This unfortunately is also one of the last steps in getting a product ready to be shipped. Becasue of this a decent number of products have great potential but have unsatisfactory documentation at best and confusing documentation at worst. Since this kit comprises three sensors and one daughter board there is a mix of documentation.
Starting with the dust sensor (T6713-6H) the documentation was terrible. The images are not intuitively or labeled in a useful and meaningful way. This has lead to unclear explanations and misunderstandings. Output pins are labeled but not necessarily explained. There are 5 pins of which 4 are explained. The last pin either called RX or N/C is not explained and sometimes not even labeled. It can only be assumed that this pin has no real use but with differing and somewhat contradictory documentation this is unclear. How the sensor detects different particle sizes is also not well explained which has lead to an unclear understanding of how to use the sensor.
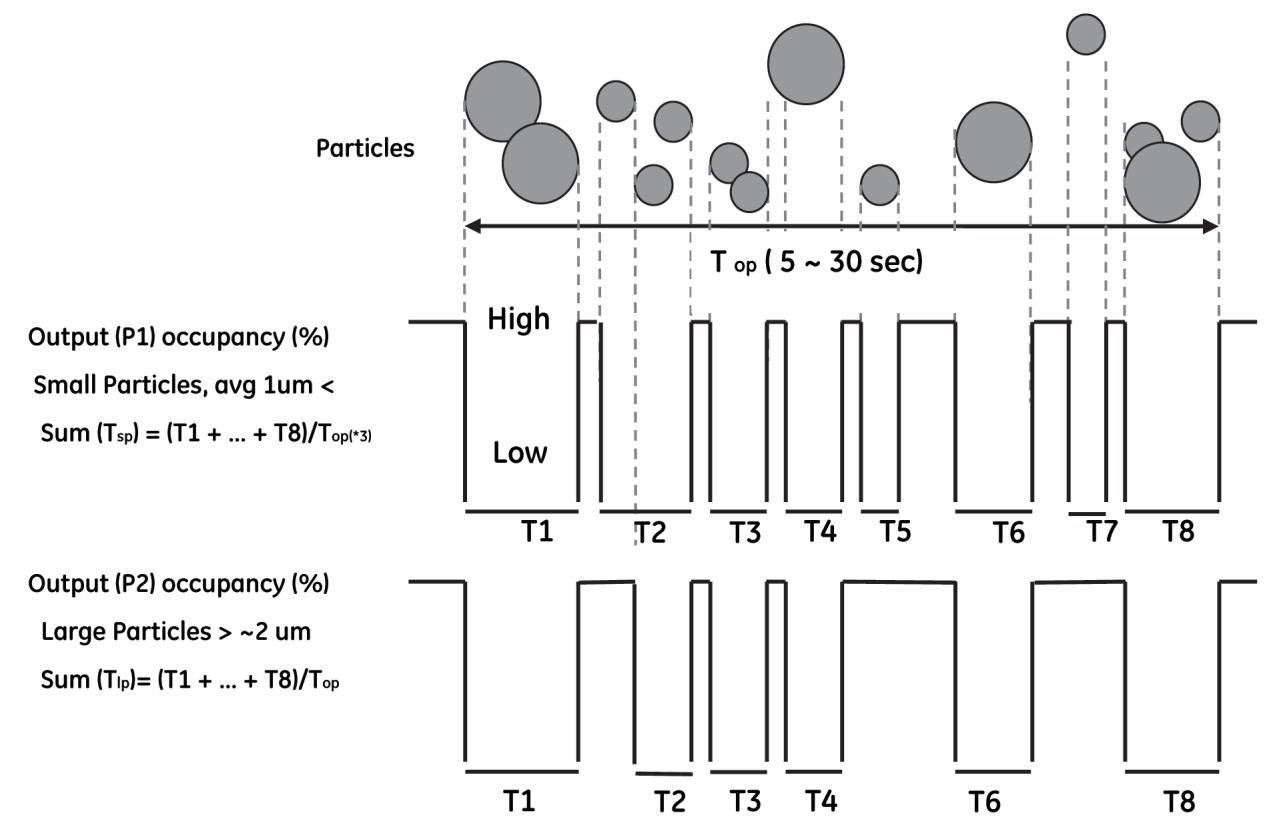
Image explaing how particles are counted/measured but not well explained
There are references to the figures in the documentation but most of the figures are not labeled leading to a need to count through the images to find the figure being referenced. The documentation also uses abbreviations that are either not explained or explained somewhere else in the document. It is clear from the documentation the low power consumption of the sensor (5V @ 90mA), it’s fast start up time (90 seconds) as well as the sample rate (5 Hz).
The other two sensors have much better and clearer documentation. The simpler of the two is the T9602-3D-1 temperature/humidity sensor. With a stated accuracy of ∓ 0.50 ℃ and 2% RH over its range of -40 ~ 125 ℃ and 0 ~ 90 RH (RH >90% accuracy can suffer up to ∓ 3%) this is a very usable and capable sensor especially with its IP67 rating. The documentation is clear on how to hook up the sensor, what external components are needed as well as the power consumption (3.3V @ 750 ~ 1100 uA). It's also clear that while there are 8 pins on the internal sensor IC only the communication and power pins are broken out. It would have been nice to have signals such as high/low alarms broken out as well as the ready signal. Its also nice to see that the 3.3V power line is separated from the signal line by ground. This is a well known but not always used technique to reduce EMI. The communication protocol (MODBUS) using both I2C as well as UART is well explained both in the text and with a very well designed infographic.
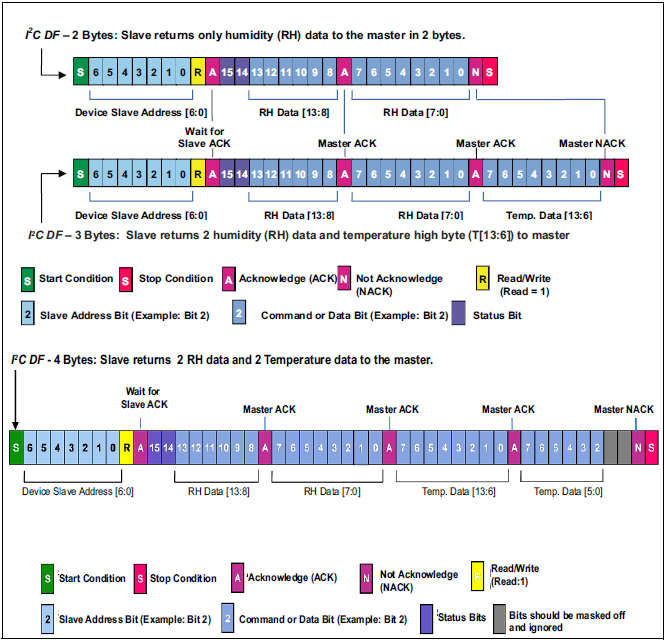
Infographic explaining the communication protocol for the T9602-3D-1 sensor
Both the I2C address and communication speed is configurable with a large range of options allowing for lots of sensors to be connected on the same I2C port. Tips on how to use the sensor for most accurate measurements are also mentioned. This includes using pulse measurements to reduce ontime of the sensor thus reducing heating of the sensor. Overall the documentation follows a logical progression making the reading and understanding of this sensor easy. It should be noted that the pages referenced for each figure are off by one.
The last sensor is the CO2 sensor (T6713-6H). This sensor has the most documentation and in some ways is the most complex. While there are not a lot of options or settings there is a start up sequence that allows for some customizations to be made depending on the environment the sensor is being used in. The T6713-6H also uses the MODBUS protocol for communication. While this possibly added a level of complexity it does allow for some level of commonality between various sensors. The remaining documentation other than explaining the various commands as well as how to change the I2C address explaines the internal ABC logic.
The ABC logic works by remembering the lowest measured value over a 24 hour period. After doing this for 7 days a statistical algorithm is used to determine if the sensor needs to be recalibrated and using those values this is done. For this to work correctly the sensor needs to see ~400 ppm of CO2 3 times in a 7 day window. Alternatively the sensor would need to see 400 ppm 4 times in a 21 day window. The ABC logic will not take into account any measurements taken from less than a 24 hour window. This means the sensor needs to run for a minimum of 24 hours before it will allow a reading to be read as a minimum value. If it is assumed the sensor will not see a 400 ppm value, the ABC logic can be turned off. Once calibrated the sensor can produce stable values in 10 minutes but has a start up time of two minutes. This would limit it uses in some products/environments where the on/off cycle time can be very short thus not allowing the sensor enough time to adequately startup or use the internal ABC logic. One thing to mention with this sensor is the list of chemicals that can adversely affect it. On this list besides ammonia, chlorine and NOx is ozone. As ozone is a natural chemical found in most environments this is an odd chemical to list as having an adverse effect.
Lastly is the documentation for the kit as a whole. For the whole kit only 4 pages of documentation are provided. Of these one is the title page, one is how to connect up the sensors another is a link to the git repository and the last one is a list of links to the sensors documentation. While this allows you to get the kit up and running by showing how to plug the sensors into the main board that's about all it provides. It would have been nice if a bit more information, even if just a synopsis of the sensor features as well as how to use the sensors, was provided. While a link to Github repository is provided, the landing page provides no useful information as where to find the actual code. Once it is realized that you need to use the Telaire subdirectory (all the sensors are supposedly from that subsidiary) you still are not presented with any code. This is because the code is in branches and each subsequent code release is a different branch as opposed to being a milestone or version number on a single branch. This leaves you unclear as to what branch to use. As no branch is labeled Uno or Arduino evaluation code or kit what code/branch to select is left ambiguous. The only help that is somewhat provided comes from a document recently added. The document labeled Changing the code in the Arduino has directions on where to download the code from. This note mentions “From https://github.com/AmphenolAdvancedSensors/Telaire/tree/Evaluation_Board_v1.4 download all files into My Documents/Arduino/TelaireSensors directory.” This is the only clue as to what code is to be used with the kit. I would be nice if Amphenol/Telaire updated the way they use git to better reflect code progression instead of separating versions of the code into different branches.
Conclusion
I believe Amphenol has provided a useful and easy way to test their environmental sensor suite. The ability to quickly and easily evaluate each sensor using either the provided OLED display or by changing the code to output the data over serial is very useful. The sensors have shown that they can successfully operate in the environment they are meant to as well as in harsher outdoor environments. The temperature/humidity sensor included was shown to live up to the expectations set by Amphenol. The results for the CO2 sensor are unclear as the readings are often quite different from two other sensors in the exact same environment. Whether this is due to a faster response time or the sensor not living up to its expectation is unclear, further testing would need to be conducted. The results from the dust sensor also left an unclear result. Responding to smoke from frying and fine dust being blown around yet not responding to thicker smoke or blowing flour. Whether this was due to misunderstandings brought out from inadequate/unclear documentation or from the performance of the sensor itself is currently unclear. Lastly the kit is well made. There are some improvements that can be made such as clearer labeling for directional connection of sensors or changing connectors all together. While the connectors selected are low cost and easy to use, an extra $1 or $2 would greatly improve the user experience and possibly allow for more favorable results for Amphenol when their sensors are being tested. (A blown sensor because of incorrect connection is never helpful in promoting a product). Overall I look forward to continuing to evaluate this product both against other sensors in my inventory as well as against calibrated sensors from reputable organizations.
Original post on Element14 can be found here
Original post on Element14 can be found here