Showing posts with label Pressure. Show all posts

Wednesday, January 24, 2018

Raspberry Pi 2/3 Weather Sensor Shield - Review


I would like to thank Element14 and TE for selecting me for this roadtest. The Raspberry Pi 2/3 Weather Sensor Shield (DPP904R000) piqued my interest for a couple of reasons. First is my ongoing interest in evaluating sensor suits. Because more companies are producing their own sensors its becoming increasingly more complex to select a sensor. Adding these sensors to my comparison chart would allow for a better understanding of the offering from TE. As an ongoing project a platform, for easy comparison of the data, has not yet been established. The second reason for wanting to review the Weather Sensor Shield is a weather balloon project that is due to be completed by the time the weather is more favourable.

First impressions - Unboxing (Lack Thereof)
The board arrived in a padded envelope and an anti-static bag. While I often prefer minimal packaging this was very much bare bones. Being accustomed to receiving even single components in large boxes this was very unusual. Without even a small box for protection, keeping the sensors safe is that much more complicated. Another point to note was the lack of any documentation. While most products do not ship with lengthy guides they do at least ship with a getting started guide or link to an online document. In this case there was nothing included to get a new user started.


The packaging the board arrived in, a shipping box from Element14, which contained the padded envelope in which was the anti-static bag 

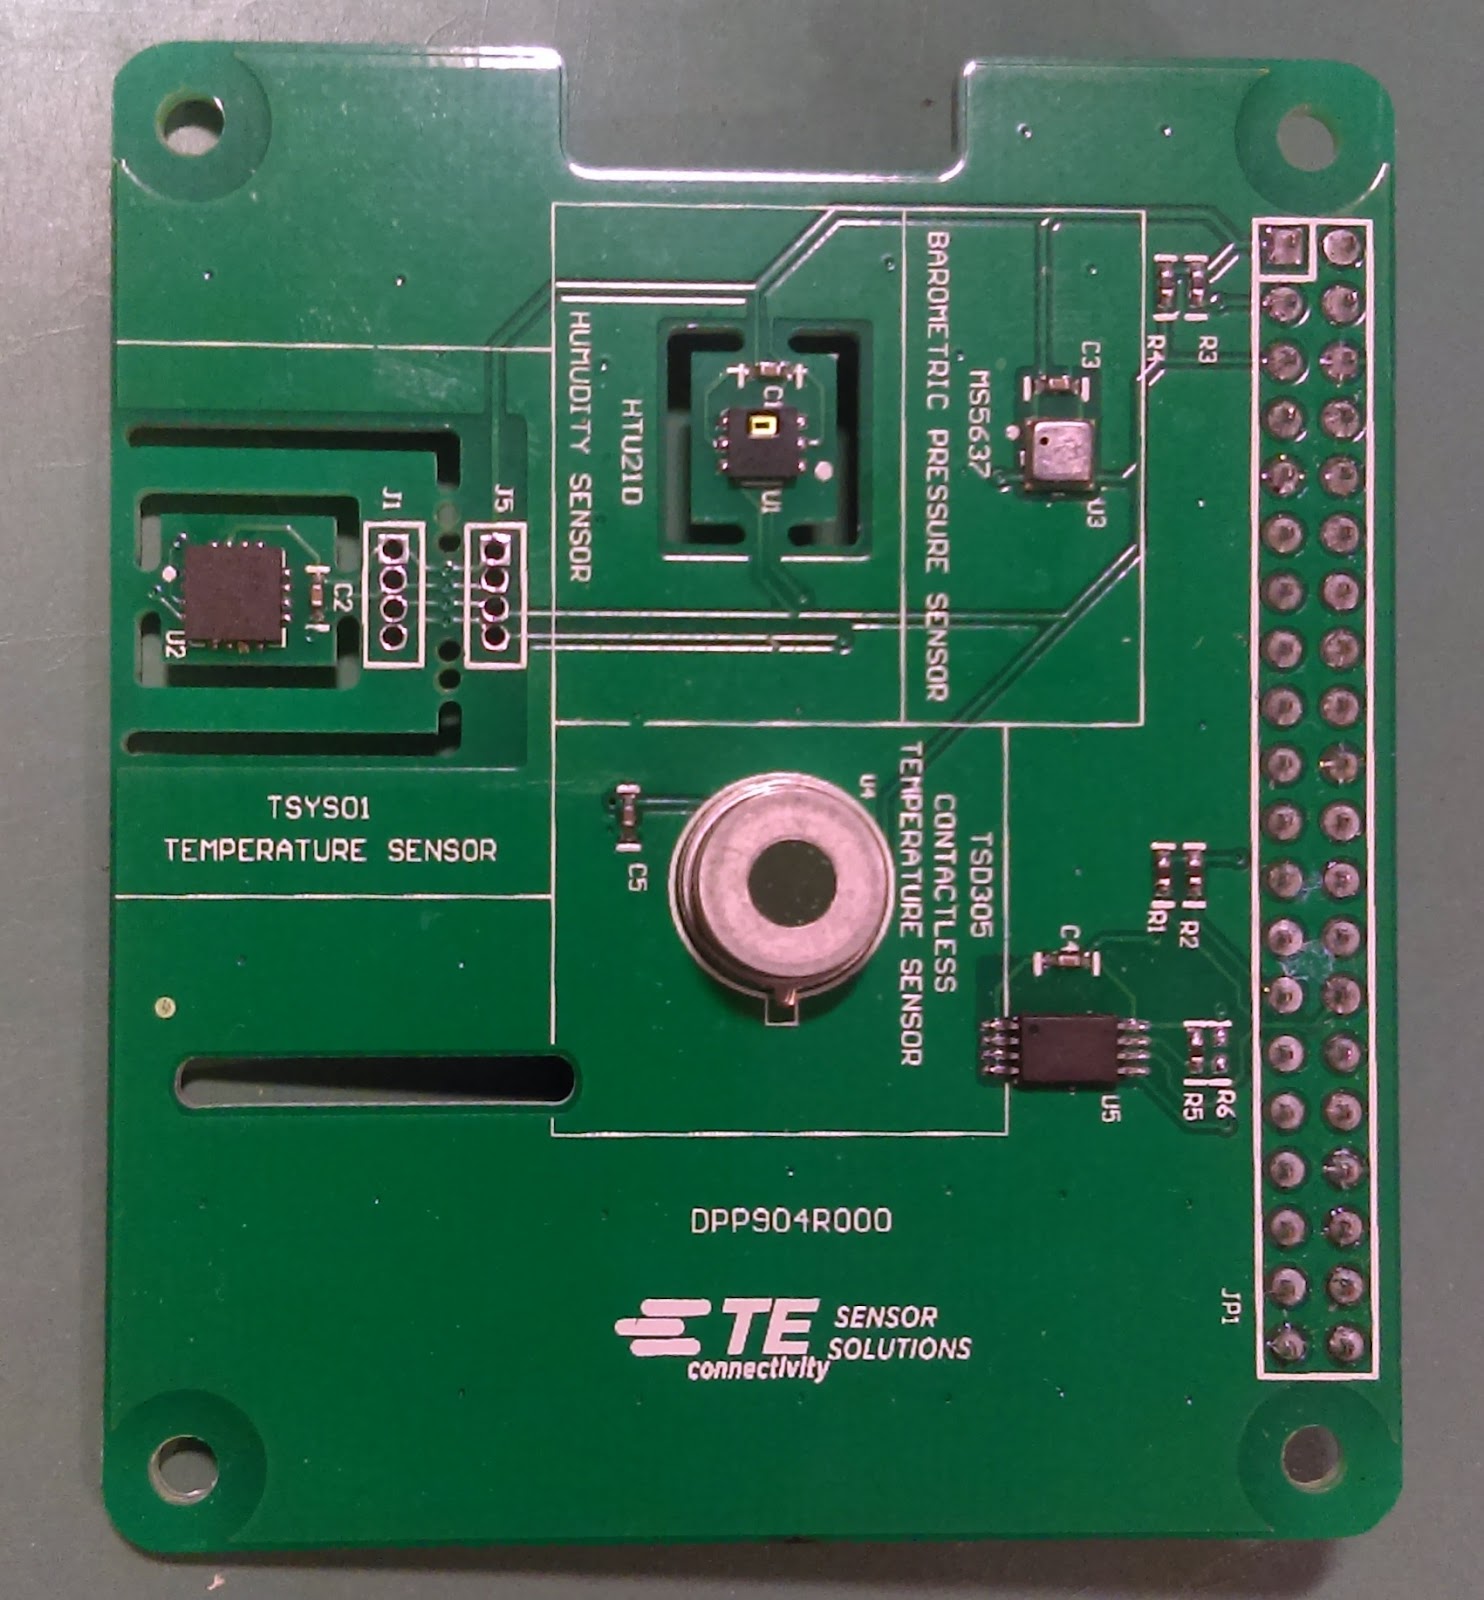
On the positive side the board is well marked. Each of the four sensors are clearly labeled. The connector orientation is also well marked to ensure correct mounting. Overall it is a simple board with ample space around each sensor to prevent thermal and mechanical interference between sensors.

Each sensor is clearly labeled as is pin #1 on the connector

Test Outline
I had outlined a series of tests for this kit to determine how user friendly it is as well as how it performs against its outlined specifications. Unfortunately, due to some issues that will explained, most of these tests could not be completed before writing this review.
The test procedure I had outlined for DPP904R000 contained approximately 5 individual tests. These ranged from the usual to those definitely not intended for this kit. The tests outlined in the proposal where as such:
  1. How easy would it be to use this with another platform 
  2. Can we get the calibration data from the PROMs easily and reliably 
  3. Does the data from various sensors match up (they each have a temperature sensor) 
  4. Can these sensors survive the outdoor environment, in a sheltered but not sealed enclosure 
  5. Can the needed calculations be carried out on a microcontroller without overloading the system 
  6. What is the true power consumption of these sensors 
  7. What is the theoretical maximum altitude that can be measured with the pressure sensor (taking temperature as well as air pressure into account) 

Due to mainly documentation complications only the first two test have been conducted so far. As more progress is made further updates will be added.

Platform Compatibility
Physical Compatibility
The first test was to see if the DPP904R000 is compatible with with other platforms that have a Raspberry Pi connector. The board selected to test this kit with was the MangOH Red from Sierra Wireless.
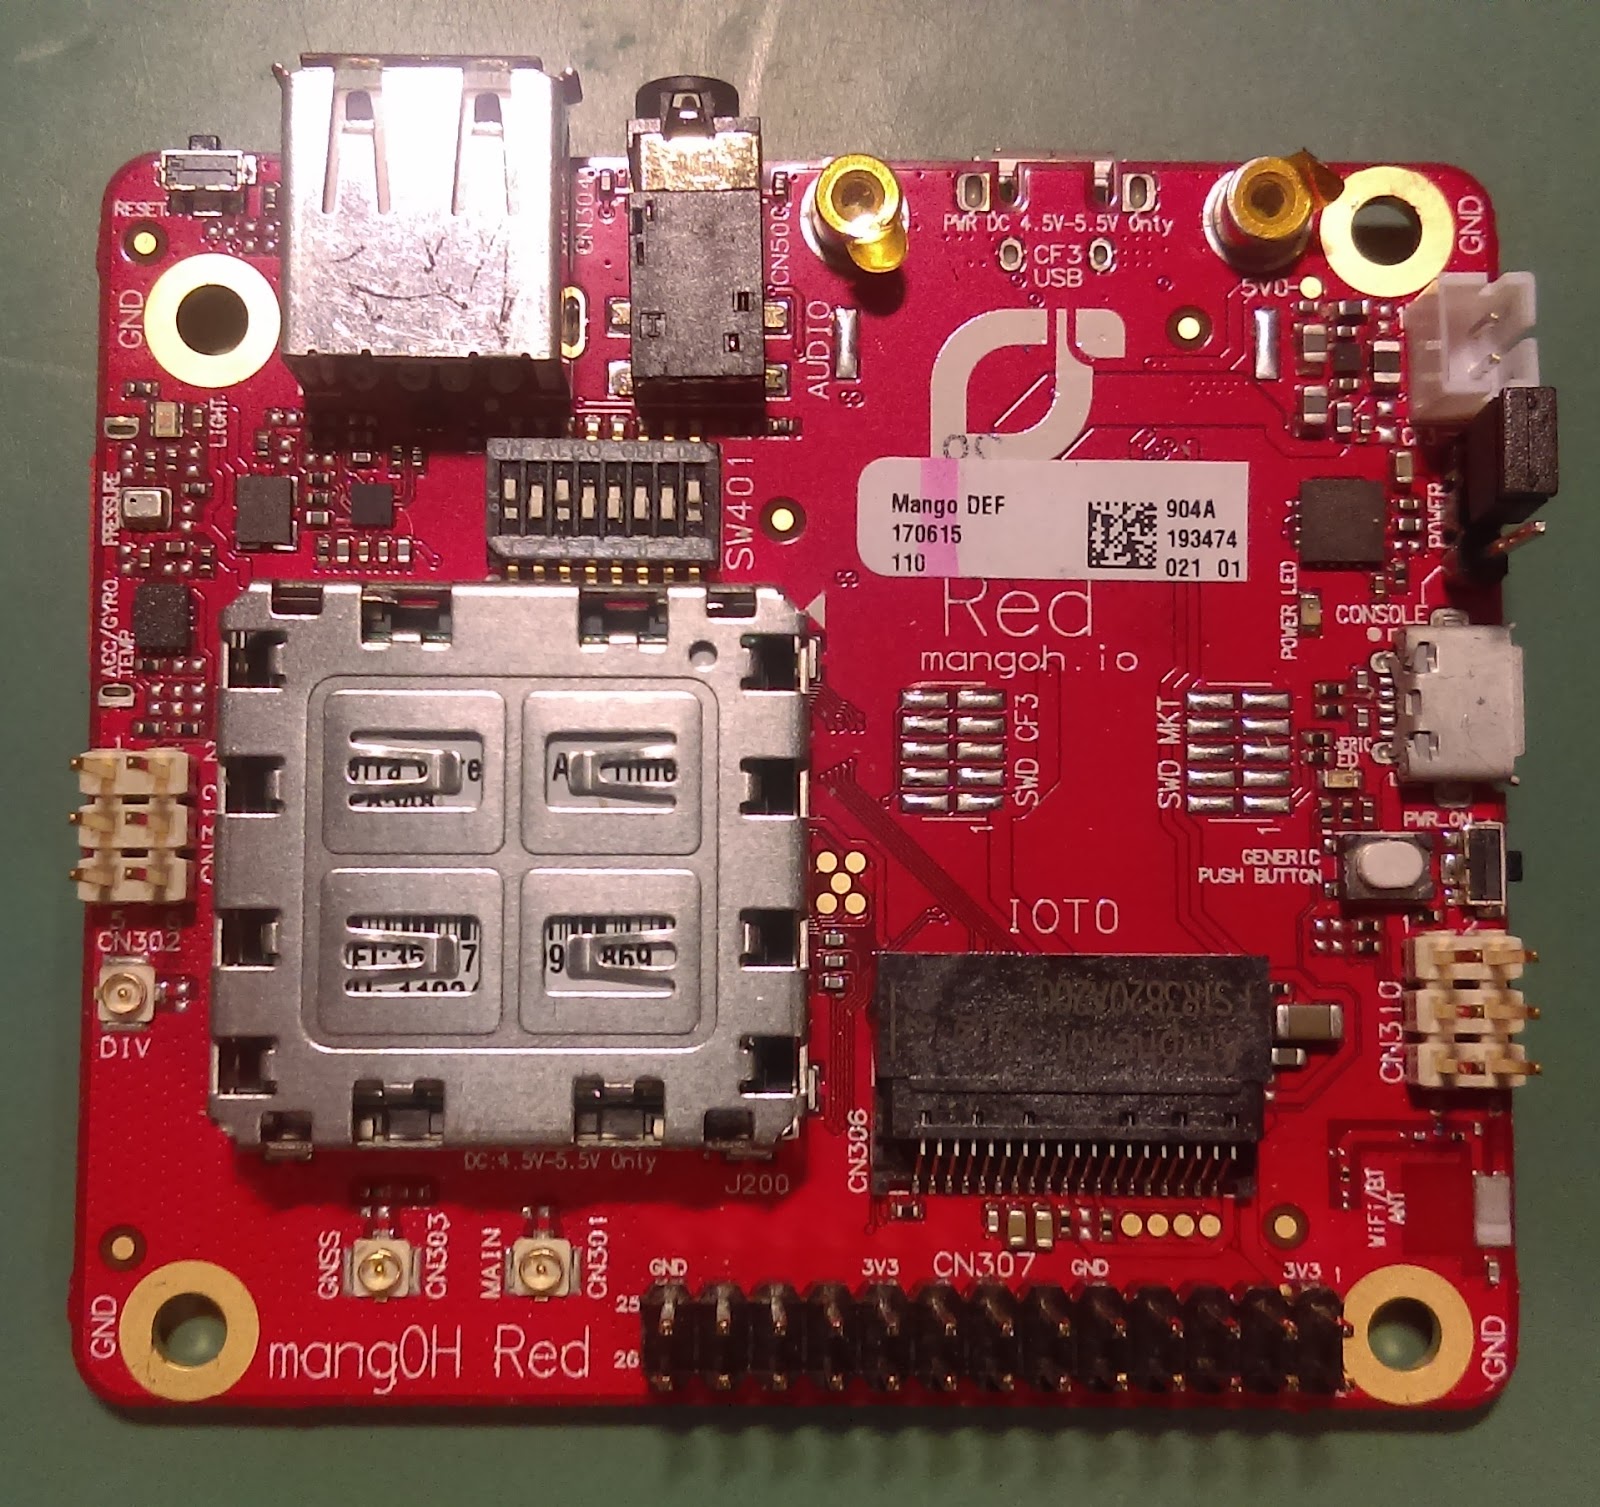

MangOH Red from Sierra Wireless

This board has a 26 pin instead of a 40 pin, Raspberry Pi connector. Even with this, only two of the six pins used are not supported. These two pins are apparently used by the Raspberry Pi to read a shields ROM chip for identification purposes. Since the ROM is not used with the MangOH Red, it would not be a concern.
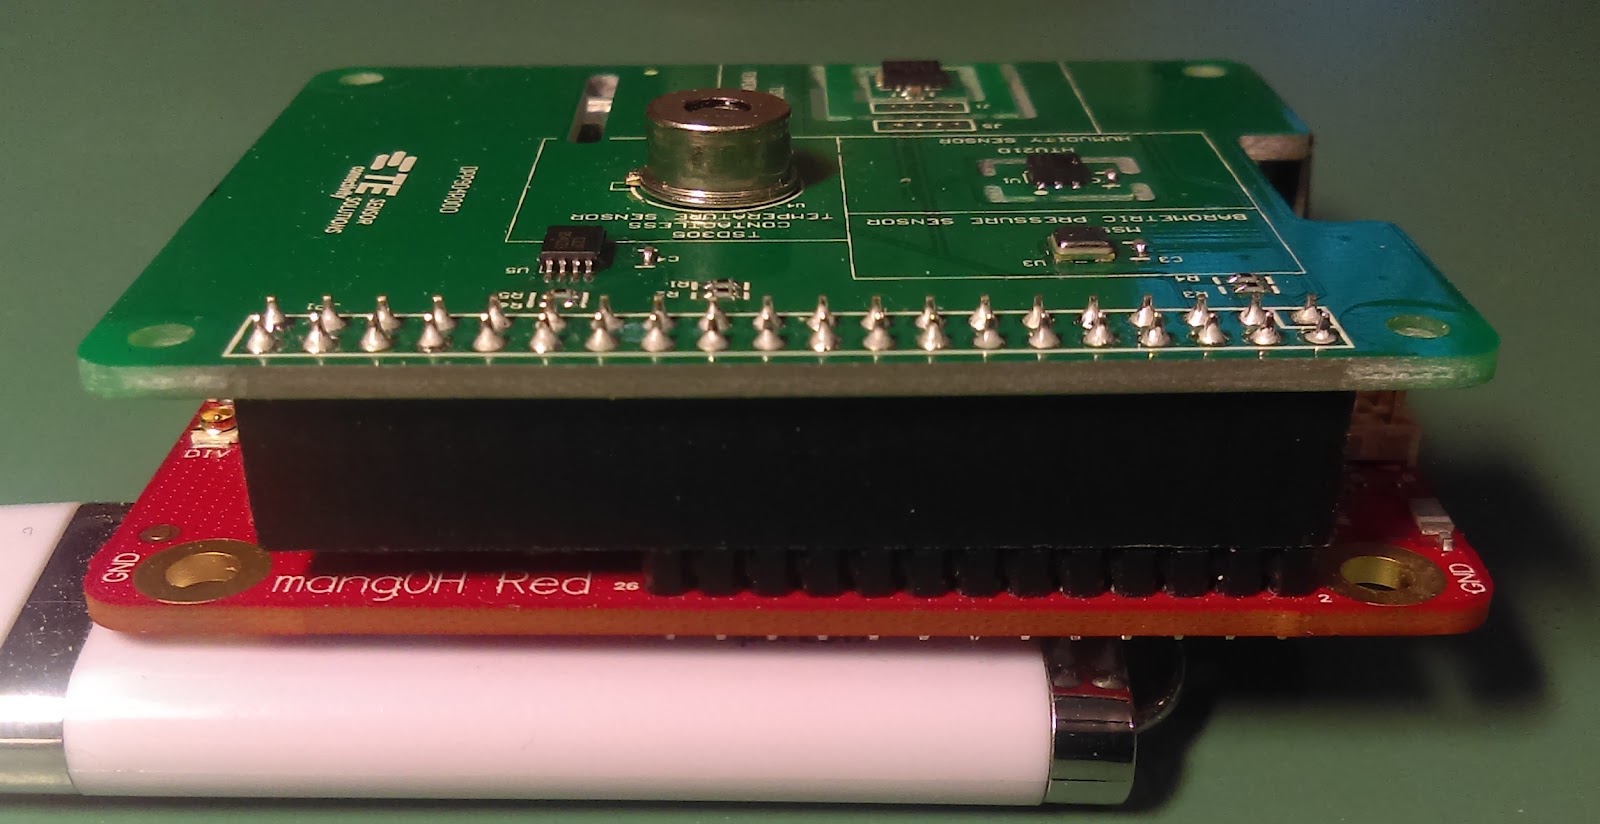

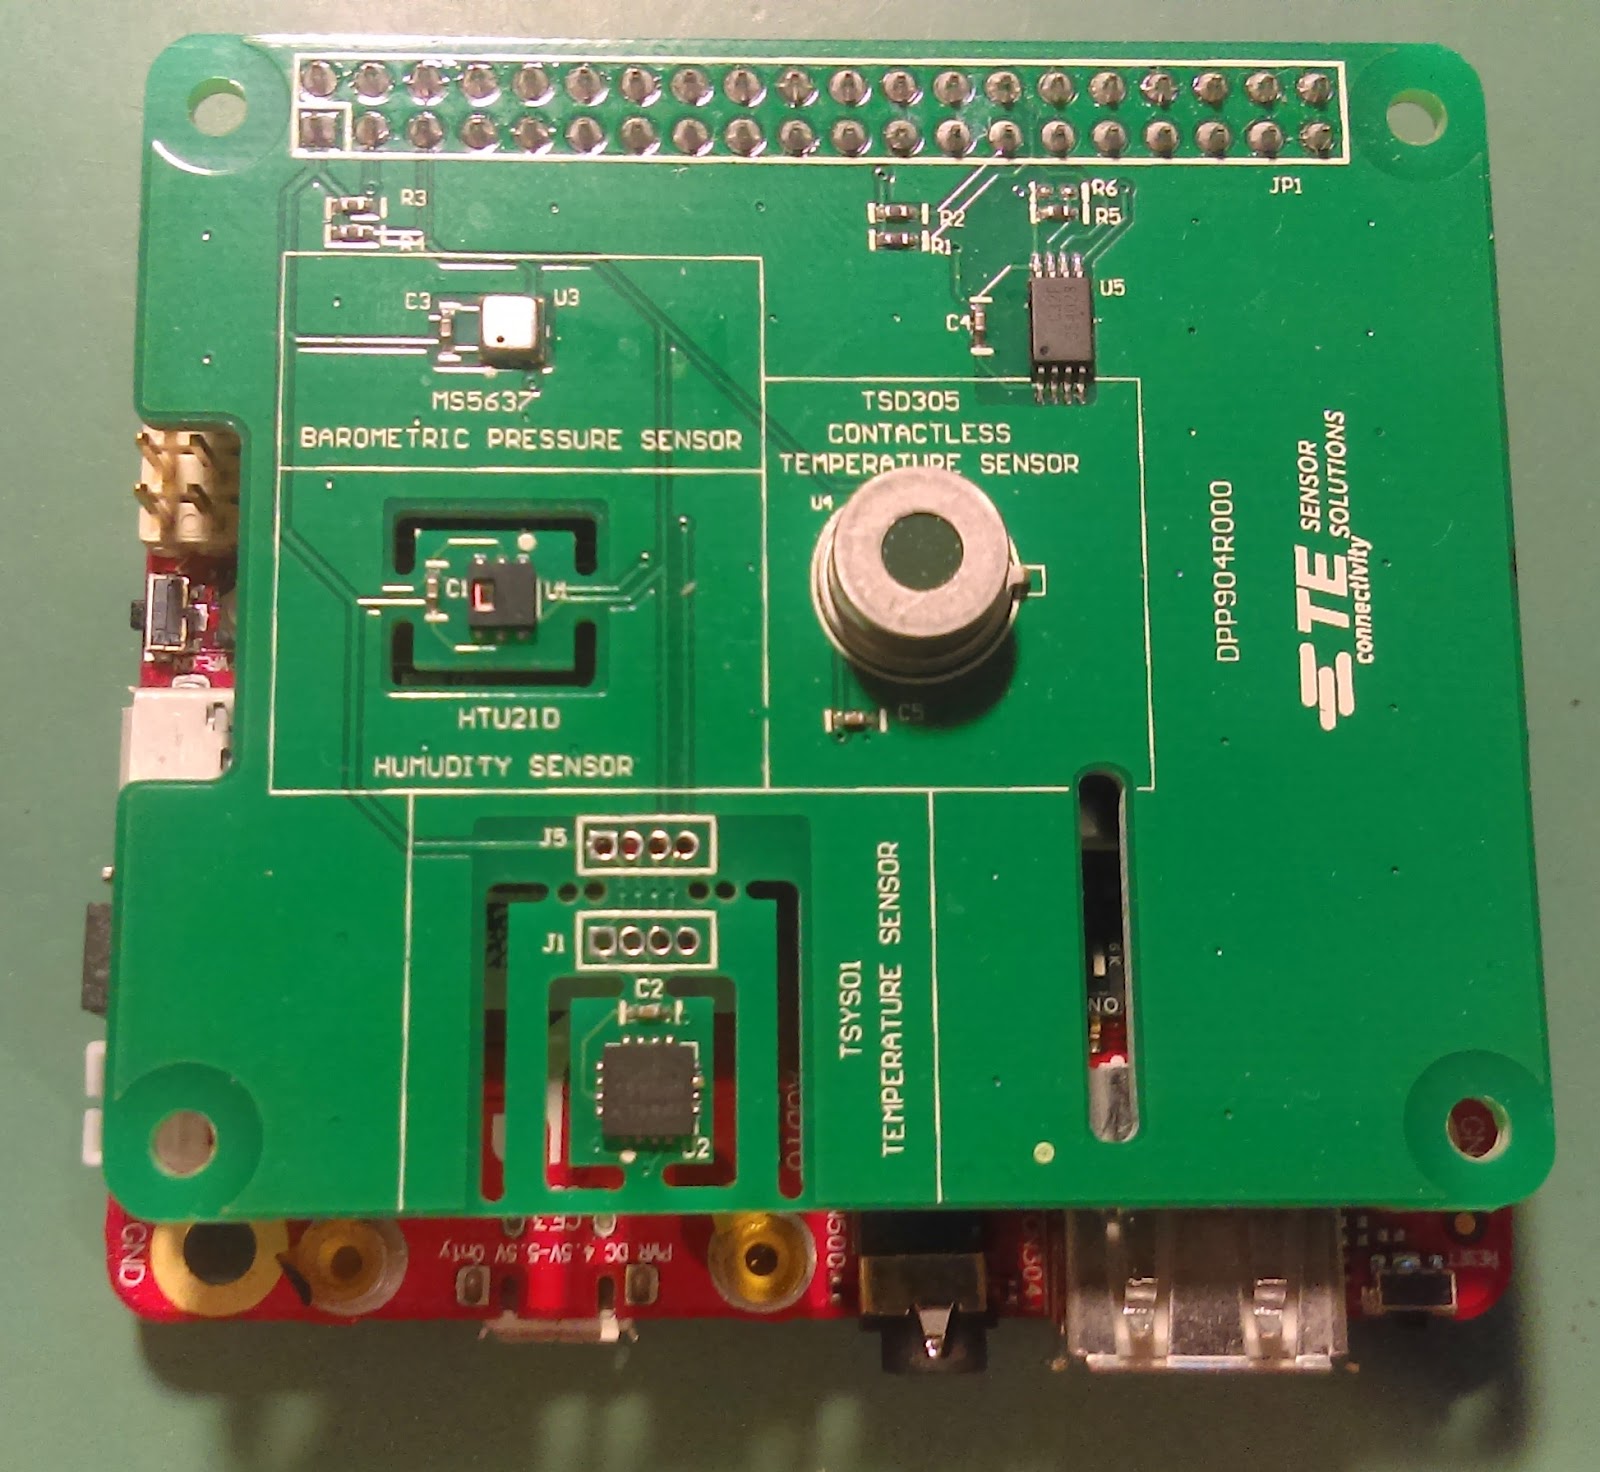
The DPP904R000 mounted on the MangOH Red, only 26 of 40 pins make contact

Communication Compatibility
Using terminal commands to test the basic compatibility between the boards was the next step before moving to any of the other tests. This would also be the first time the documentation was consulted in detail. Any product that survives needs good documentation or support. This is where the Raspberry Pi Weather Sensor Shield started to have issues.


i2cdetect shows 0x76 is reserved by the system and that only the TSD305 at 0x1E is detected
 
The first sensor tested was the HUT21D humidity sensor. This sensors has an easy to follow communication structure. Shortly after reading the datasheet humidity data was being reported back. This quick victory gave a positive feeling towards the Raspberry Pi Weather Sensor Shield, sadly this victory was short lived.

The HTU21D humidity sensor with thermal isolation 

The second sensor to be used with the MangOH Red was the TSYS01. The address listed for the TSYS01 temperature sensor is 0x76 and 0x77 depending on whether the CSB is pulled high or low. Since the MangOH Red has a sensor (BMP280) at 0x76 the TSYS01 sensor could not be reached at this address. However, because the TSYS01 can change its I2C address, there was hope. Looking at the schematics it was revealed that TE did not design this option into their board. While cost could have been a factor ($0.03 for the 0𝛀) there are ways around this (Freescale now NXP, is great at giving options without increasing cost). Unfortunately because of this, the TSYS01 is unusable with the MangOH Red. It would later be discovered that in fact the address could not be changed without causing another conflict.
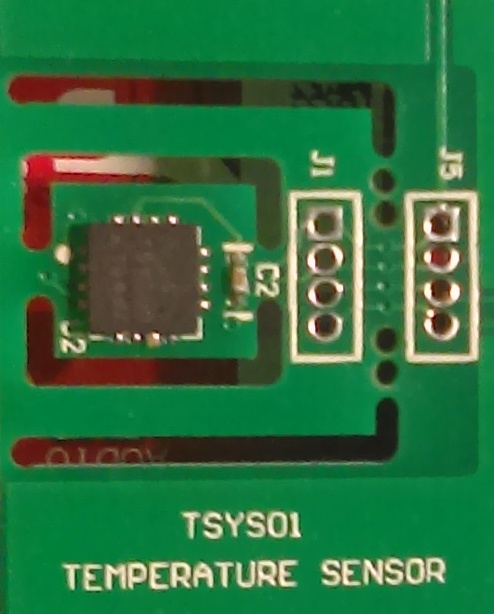

The TSYS01 temperature sensor with multiple layers of thermal isolation 

The next sensor to be checked for compatibility was the TSD305. While even bad hardware can be made to work with great documentation, no hardware can work with no documentation. This was in essence the case with the TSD305. 
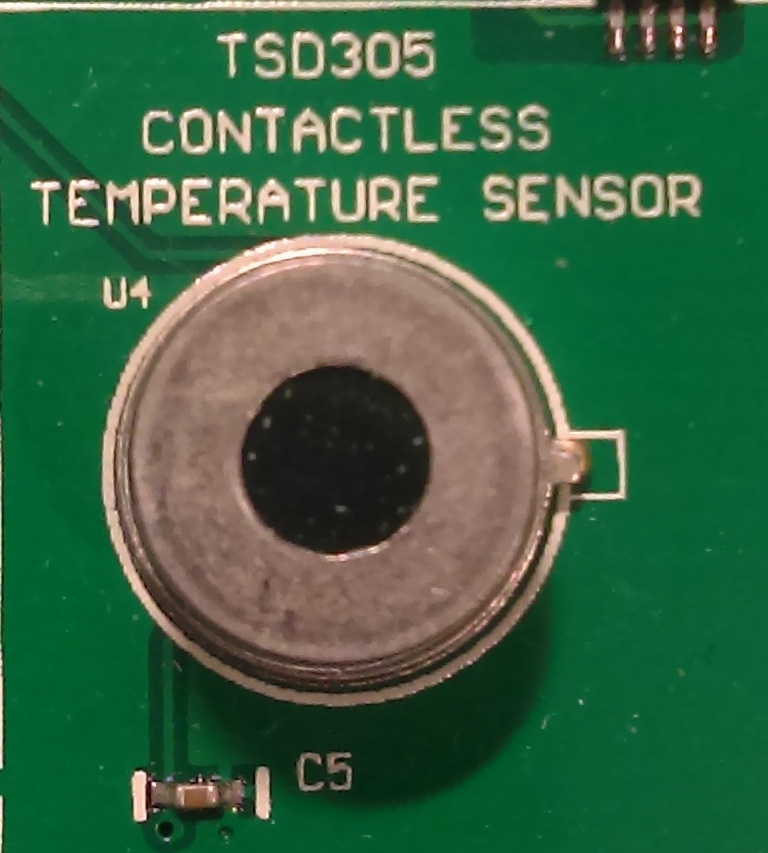
The TSD305 contactless temperature sensor 
 
The datasheet lists the address as 0x00. Interestingly Raspbian (which this board is specifically made for) and other Linux distributions, reserve this address and so its not accessible to the userspace. This left this sensor unusable until I was lead to TE’s GitHub repository. Initially I was shown python drivers, while I was working in the terminal and C this was still more promising than the documentation. Looking through the files it became clear the correct address for the TSD305 is 0x1E. Due to receiving this information rather late, no further testing was conducted with this sensor.


Datasheet displaying 0x00 as the sensor address 

The last sensor to be tested was the MS5637 pressure sensor. Following the sequence of steps need to complete a measurement it is unclear what addresses need to be written/read to/from. At issue are the large number of address available write too. Whether reading pressure or temperature data there are 6 different registers that can be written too, each with a different OSR value. Compounding the matter, is the lack of explanation regarding OSR or how it affects the measurements. Choosing one of these at random the data still needs to be read from the ADC. With no mention of one or two ADCs, at first glance is unclear what address each data point should be read from. Through more careful reading it can be inferred that there is in fact only one ADC.
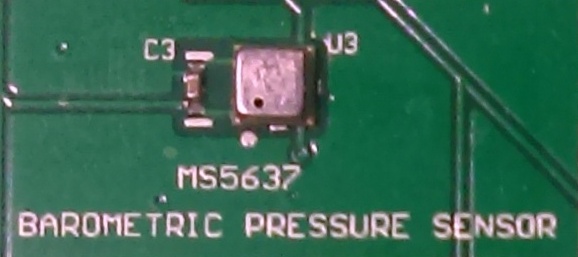

The MS5637 pressure sensor

Once the sequence of events were clarified an attempting to connect with the MS567 was made. The address for the MS5637 is listed as 0x76. As previously noted, this address is already used by the TSYS01. Besides this address not being incompatible with the MangOH Red, its not compatable with the TSYS01 on the same board (DPP904R000 ). With the unclear sequence of steps along with the an incorrect device address, this device’s documentation is the worst of the four sensors on the DPP904R000 .


Datasheet displaying 0x76 as the sensors address 

As mentioned with the TSD305, the driver files do contain usable information. Very disappointingly TE carried over their mistake from the documentation to the repository. While the hex value is listed as 0x77, which is correct, no one checked the binary value copied over to notice it is in fact 0x76.
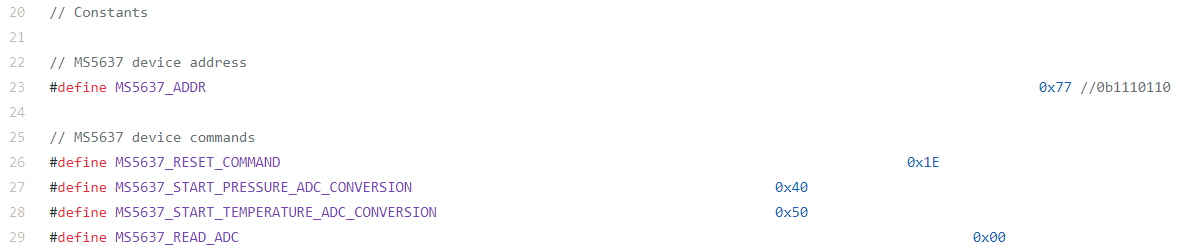

The define statement for MS5637_ADDR lists the address as 0x77 and 0b1110110 which are not the same value
 
This leads to another issue. Why would TE select address for different sensors to be the same. Regarding the ability to change address the TSYS01 documentation states “Therefore, two TSYS01 can be interfaced in the same I2C bus”. How can this be so, if the application requires a pressure sensor the second address would be consumed by the MS5637. With 124 address available TE selected two separate sensors that could easily be used in the same application to have overlapping addresses.

Easy of Use with Higher Level Code
The sequence of steps needed to conduct a measurement for these sensors are not necessarily very efficient. The HUT21D requires the system to wait for the measurement to complete before receiving a response. During this time there are two options available. The first option is to wait while the HUT21D holds the SCL line low. This prevents anyone else from using the I2C bus. It may also hold up the system depending how the code is implemented. The second option is to poll the HUT21D waiting for an ACK. While this allows others to use the I2C bus it does require the system to poll the sensor. The other three sensors only provide polling as an option to retrieve data. A better and more efficient option would be to implement an interrupt pin. While this could still require polling in some systems, the time needed to do so would be reduced from milliseconds clock cycles.

This may not be an problem in some systems and even more so in the systems that appear to be targeted by TE. However in low power or time critical systems the extra cycles can reduce battery life or the ability to process data ontime. This would lead to a contradiction in the claim to low power yet the need to use more power to execute and retrieve a measurement.

Documentation and GitHub Repository
As previously noted the documentation for these sensors is lacking, some more than others. There is both missing information as well as clearly incorrect information. The biggest issue found working through these datasheets was the with the TSD305. In this case the sensor address was incorrectly listed as 0x00 instead of 0x1E. Other less critical omissions are lack of explanations or clarifications on how the sensors behave. The most noticeable of these is the OSR values in the MS5637 datasheet. Also unclear in this datasheet is the number of ADCs, the relevance is whether or not there are multiple addresses to read from or not. This though can be clarified with a more careful reading of the datasheet.

One thing that that is very helpful and allows a user to achieve the stated accuracy quickly are the worked examples. The datasheets for each sensor has a fully worked example from capturing the ADC value to computing the actual measured value. Even the simplest of sensors, the HUT21D, has simulated input data that is then converted. This gives a user real values to run through the code to check the calculations with.

Possibly the biggest omission in the documentation is the mention of a GitHub repository for these sensors. This repository contains generic C and python drivers. Also in the repository are demos and drivers for Arduino. The complication here appears to be two different product pages for the same product. The page linked from Google as well as some of the vendors does not mention GitHub or IBM BlueMIX. However, another page found does, under “Related Materials”, mention both of these resources. Also at issue is, while these are mentioned in the datasheet for the DPP904R000, it is done so at the bottom where most companies put their copyright and revision information. This means its in a place a decent number of users will not look.

This lack of exposure puts TE’s sensors at a disadvantage over other sensors. While other companies are showing off the drivers for their sensors, TE is not effectively letting users know theirs exist.

Next Steps
Moving forward I am looking to complete my testing with this board. Once completed the data should be available in real time to compare with other sensors in my lab environment. Beyond this is the hope to be able to integrate the sensors (excluding the TSYS01) in the weather balloon project. This would help to determine how reliable they are in such an application as well as how altitude affects them. Included in this is a test to see what is the maximum altitude that the MS5637 can reliably report.

Conclusion
From the limited amount of testing possible with the DPP904R000 it can be said this board is mostly compatible with other platforms. At issue is TE’s decision to not take advantage of the ability to change the I2C addresses where possible. This not only limits its compatibility with the MangOH Red but, potentially with other boards that may be used in conjunction with it. Indeed it is true that this would not help on this board, that is because TE has decided to allocate overlapping addresses to different sensors. Why TE would select address that potentially conflict with their own sensors is baffling at least and self harmful at worst.

The documentation also for the most part does allow for a developer to complete his task. The problem here is the extra time needed to do so due to missing or incorrect information. With a few fixes this could easily and quickly be resolved. Along the same lines is to fix the product pages. Not just the page of the DPP904R000 but of each sensor to include a link to the GitHub and IBM BlueMIX pages.

Once these obstacles are resolved the DPP904R000 would be a great product to work with for most applications. Not included in this category would be time critical and potentially power sensitive applications. The stated accuracy, factory calibration make for a reliable sensor for indoor environmental sensing applications.


Original post on Element14 can be found here

Tuesday, January 13, 2015

Child Safety Seat Using the KEA-64 to Prevent Heat Stroke

Introduction
This past summer has been somewhat of a sad one. With this past summer not being particularly hot there was still an ongoing media presents of infant fatalities related to heat stroke due to these unfortunate children being left in cars. This past year alone in the USA there were approximately 30 fatalities due to heat stroke[1]. For some people and even the car companies this sounds like a small number and a number that does not warrant the need to invest any engineering resources, but for each of those children and parents or for someone who needs to deal with the aftermath, there may be a different view. For this reason I started thinking what would be an easy and simple way to help these children.

This graphic SIMULATED video gives an awfully real feeling of what a child goes through as they experience this horrible ordeal.

Issue & Resolution
It is known that the greenhouse effect is the major cause for a car heating to well above the outside temperatures. This happens when sunlight passes through the a window and strikes an object inside the car converting the sunlight to a longer wavelength that cannot escape thus increasing the temperature in the car.

Figure 1. Greenhouse Effect Causes a Car to Heat Up Quickly

A seemingly simple solution would then seem to be to break thermal seal allowing for the heat to escape and reducing the internal temperature. If the windows of the car could be opened then the temperature would not increase as fast and may even decrease. The objective behind this solution was to find an immediate low cost low complexity solution. Allowing strangers to help also seemed a reasonable option. This assumption was made due to the realization that in most cases where children were saved from extreme harm and even death, it was often a stranger that helped, so why not start with that as a part of the solution.

There have been other attempts to resolve this issue but they are usually complex solutions requiring a decent amount of infrastructure. As car companies are dealing in the millions of units, anything that adds even a 1¢ quickly adds to $10,000 over the manufacture of the product. While this may seem trivial, to a CEO and shareholders this is money no longer in their pockets and therefore lost revenue [2]. For this reason alone it is worth keeping the system to minimal cost input and try use systems already available in a car.

System Hardware
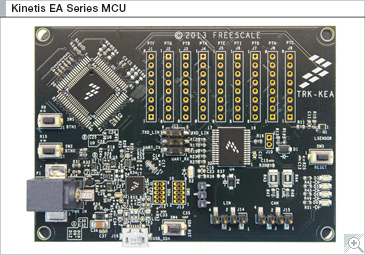
Freescale recently released their KEA family of ARM processors. These microcontrollers are made for automotive applications and therefore have specs that allow them to operate in the temperature range of -40 ℃ to 125 ℃ (-40 ℉ to 257 ℉). Using the KEA64 as a starting point a very simple and basic prototype was developed to see how well it performs, if the basics could be proven to work and show its reliability and safety than it would be worth attempting to incorporate such a system in an actual car.

Figure 2. TRK-KEA64 Development Board

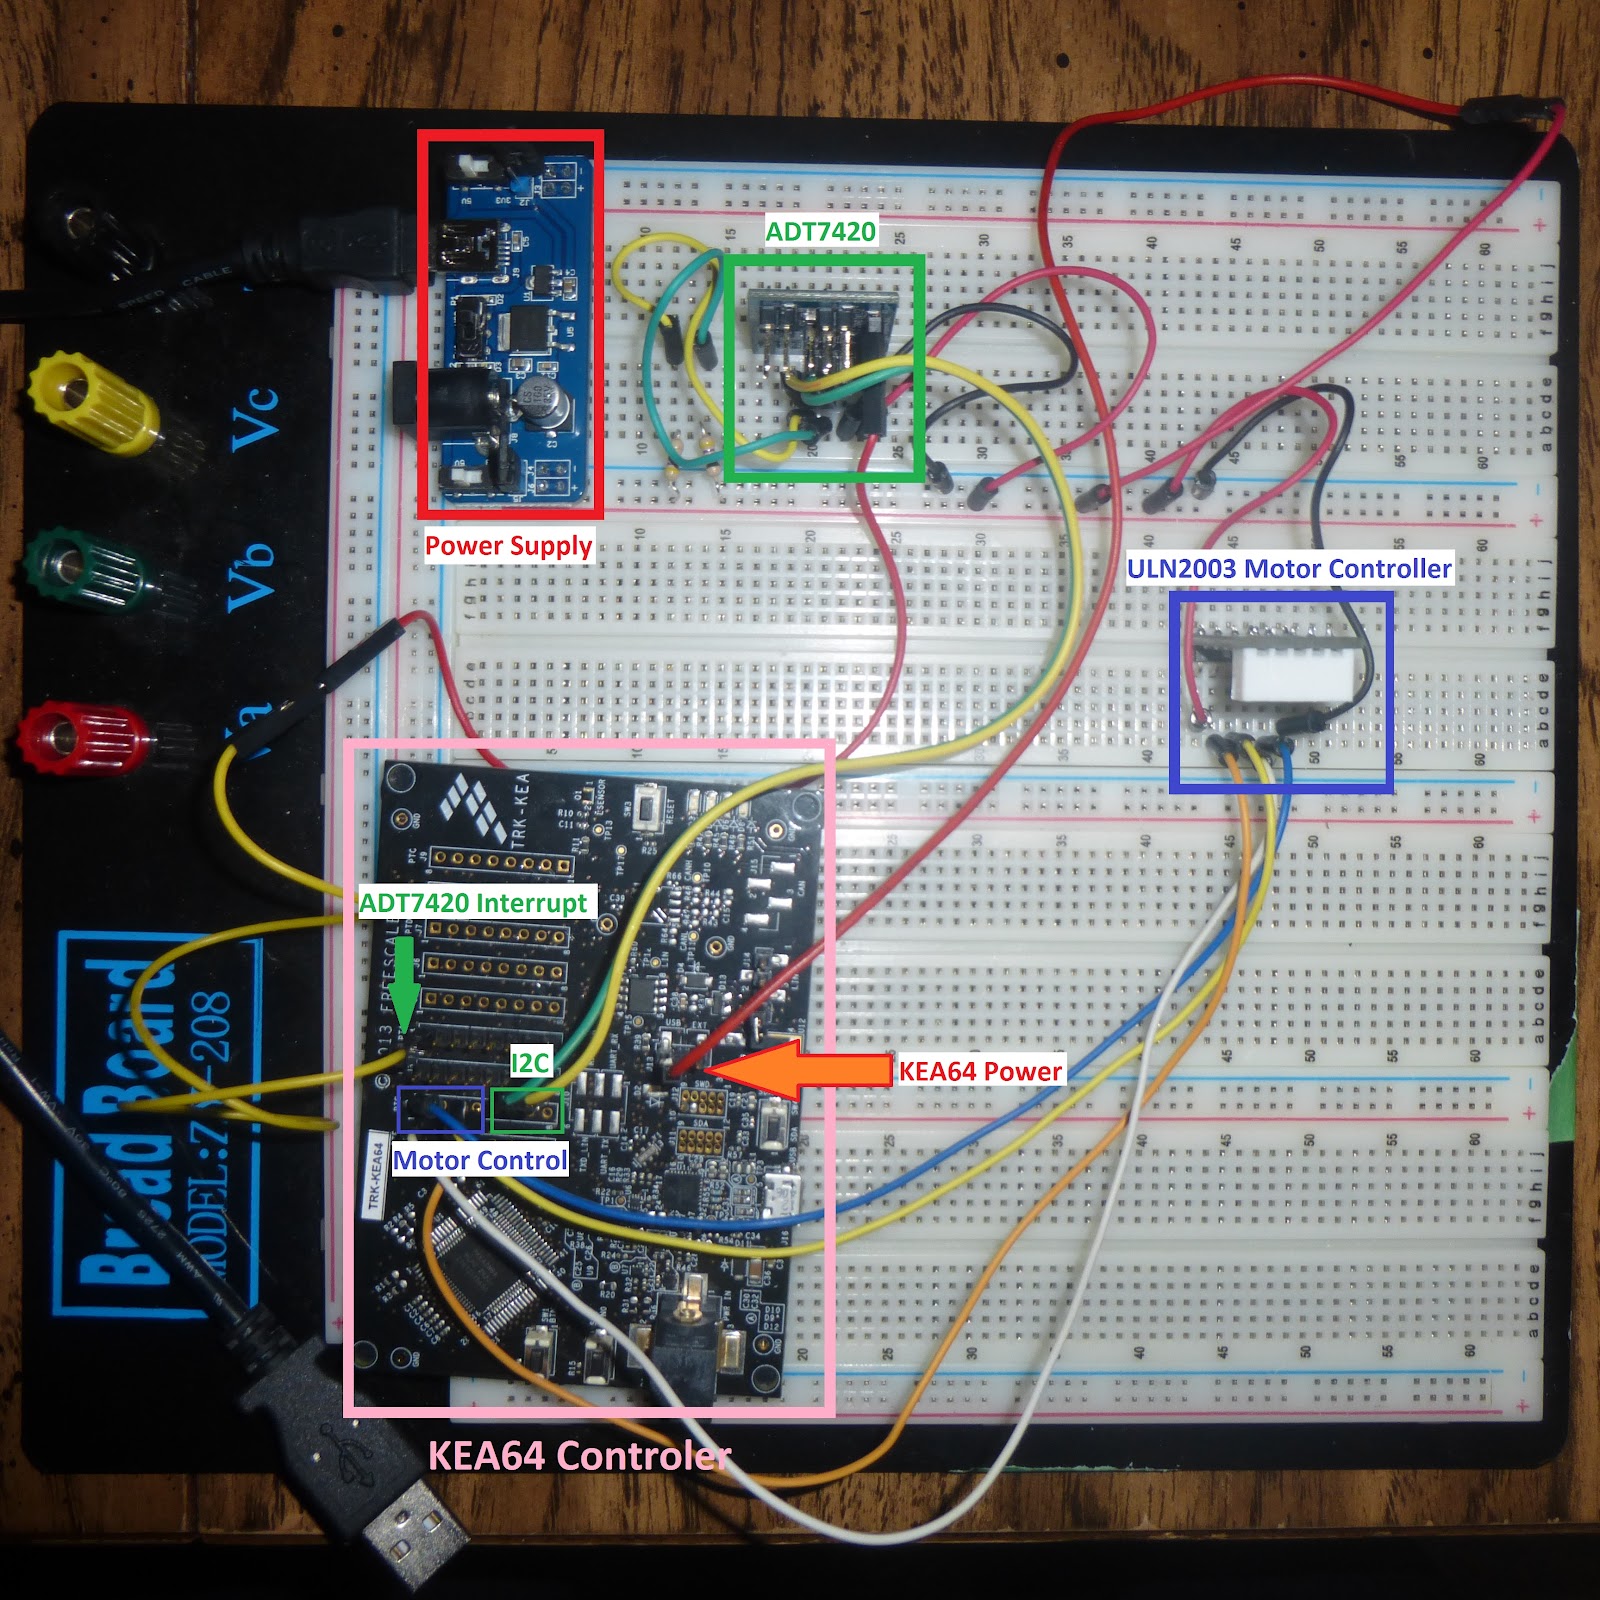
Keeping to simplicity and minimalism the demo system is composed of only 4 components. These components are the KEA64, an ADT7420 and for the demo a stepper motor controlled by a ULN2003. Missing from the demo are pressure sensors used for child detection. The system operation follows a simple linear flow removing potential logic confusion or code errors.

Some extra hardware was used in this demo, but the basics of the system is already found in most modern cars today. While some extra coding may be needed, the overall system could be implemented with no additional hardware added by the car company. The addition of pressure sensors as well as communication from the car seat to the car could be added to the cost of the car seat removing this from automotive production cost. This no extra cost method may allow for more serious consideration and implementation by a manufacturer.

System Operational Model
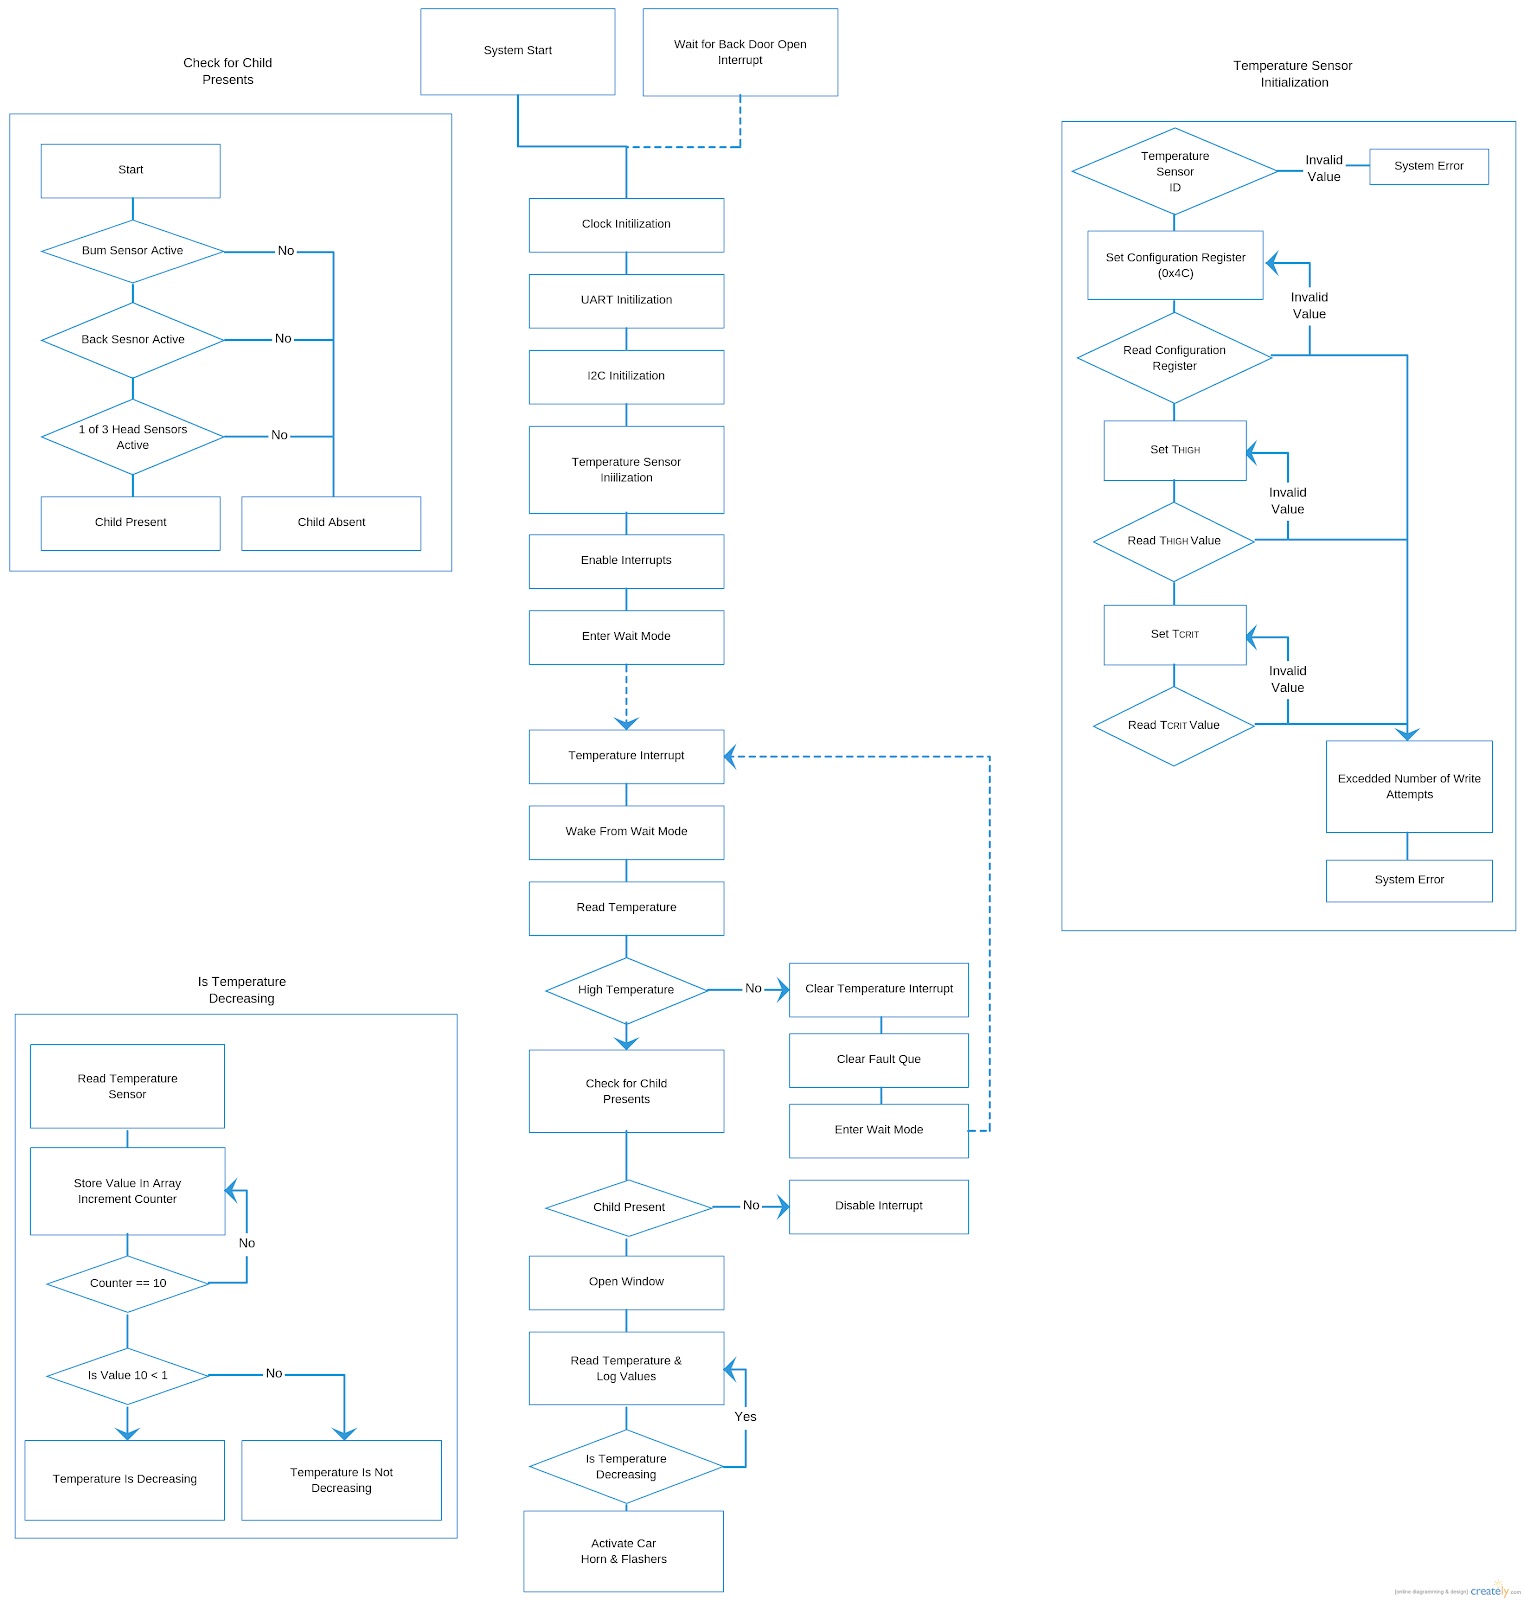
The program in the KEA64 is interrupt driven allowing for simplicity as well as maximum power consumption. The flow of the program is outlined in figure 3 below.


Figure 3. System Flow Diagram

The system is initialized when the car is powered up (change of battery) or when the back door is opened. This is done to ensure whenever a child is in the back seat the system is in a known state. During initialization the ADT7420 is set to sample once per second and interrupt on a high temperature. Once initialization is completed the system goes into a low power state. The system will remain in this state until either the back door is opened at which point the system is reset or until a high temperature interrupt is fired.

If a a temperature interrupt is fired the system wakes to start doing a situation assessment. The first step taken is to check the car's internal temperature. This is done to prevent the system activating based on a false interrupt. Should the interrupt in fact be false the system is put back in power saving mode to once again await a temperature interrupt.

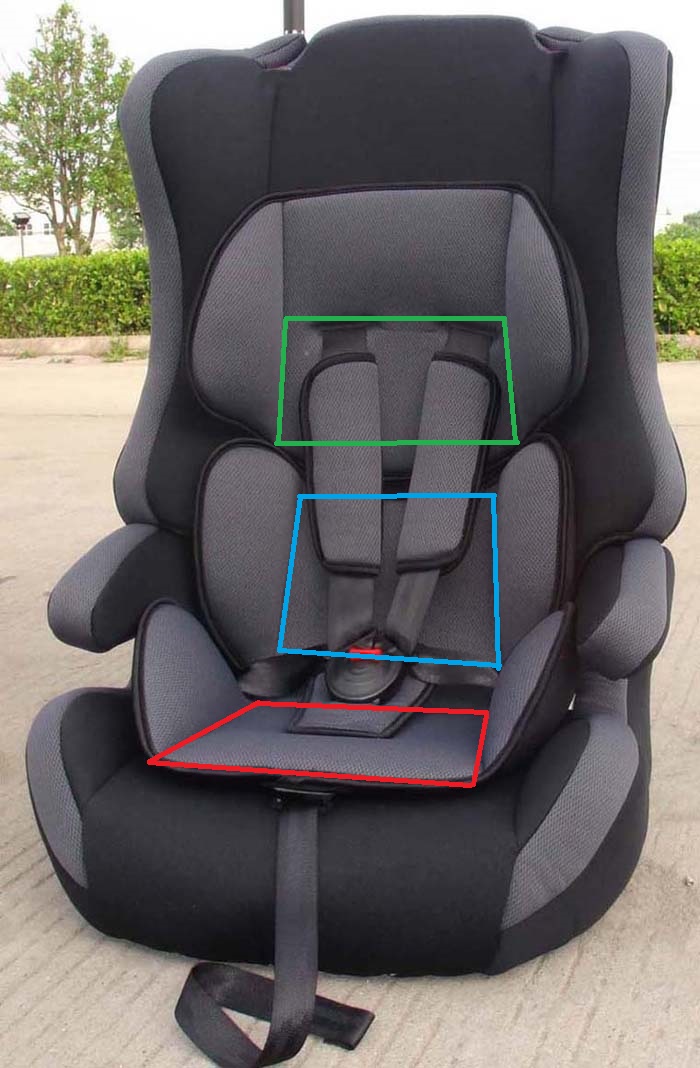
However, should it the system verify the cars internal temperature is high the system will then attempt to check if a child is present in the car. This is done by reading three pressure sensors fitted in the child's car seat. The sensors would be fitted to the bottom, the back and shoulder section of the seat. If a child is in fact in the seat and not something else 2 of the 3 sensors should indicate so. Using this method of two out of three the system would then assume a child is present  and move to the next step. This would involve opening the windows and monitoring the car for a reduction in temperature, if the car does not begin to cool the horn and flashers could be activated in an abnormal fashion to attract the attention of other people in the vicinity.


Figure 4. Locations of Pressure Sensors in Child Seat

If instead it is found that although the car is at a high temperature but there is no child present the system would disable the temperature interrupt and go back into a low power mode. The disabling of the interrupt is to prevent further false alarms until a child is possibly placed in the back seat. This would be determined by one of the rear doors opening. Once opened the system would once again reset itself starting the monitoring cycle anew.

Code for the above system can be found here

Initial Concerns and Solutions
When starting of the project one major issue that was a recurring concern among people consulted for this project was theft. There appeared to be a concern that if someone could somehow heat the car to the critical point, the windows would open and the car could be easily broken into. For this reason as well as others the need for sensors in the child seat to detect whether it is in fact a child present is crucial. In the initial attempt it has been assumed that a three sensor system would be sufficient. By placing a sensor in the seat, back and shoulder parts of the child seat it would be possible to determine if a child or something else is in the seat.

Another concerns was power consumption. While it is often assumed a car has a large battery that could not possibly drain easily this thinking needed to be reconsidered. The first issue pointed out was the other systems using power, each device added could easily tip the consumption scale causing  unsustainable power consumption . Another scenario is a car left for a long duration without being driven. In this case the battery has no chance to recharge and therefore if a car was left for several months the battery would be dead. For this reason the system is put into a low power state to reduce power consumption. The KEA64 when in run mode uses 6.7 mA (~2.25 Ah over 2 weeks) and 5.5 mA in WAIT mode (~1.85 Ah over 2 weeks). If the KEA64 is however in STOP mode the KEA64 only draws 145 µA (~48.7 mAh over 2 weeks) even with the ADT7420 sampling at 1 sps which has a current draw of only 65 µA (~21.5 mAh over 2 weeks) the total over a two week vacation would be 70.2mAh.

It is for this reason if an interrupt is fired and a child is deemed to be absent the interrupts are disabled. This prevents the system needing to wake each time the temperature gets above a set value when it is already known a child is not present.

System Testing
The system was tested at various stages during the project as well as upon completion. During the project a hair dryer was used to simulate high temperatures. While the whole system was not subjected to these elevated temperatures this method was sufficient to test the functionality of the system. Included in this testing was successive cycling to ensure such cases as a car being cooled by AC and than left to heat up and then cooled again would not negatively affect the system.

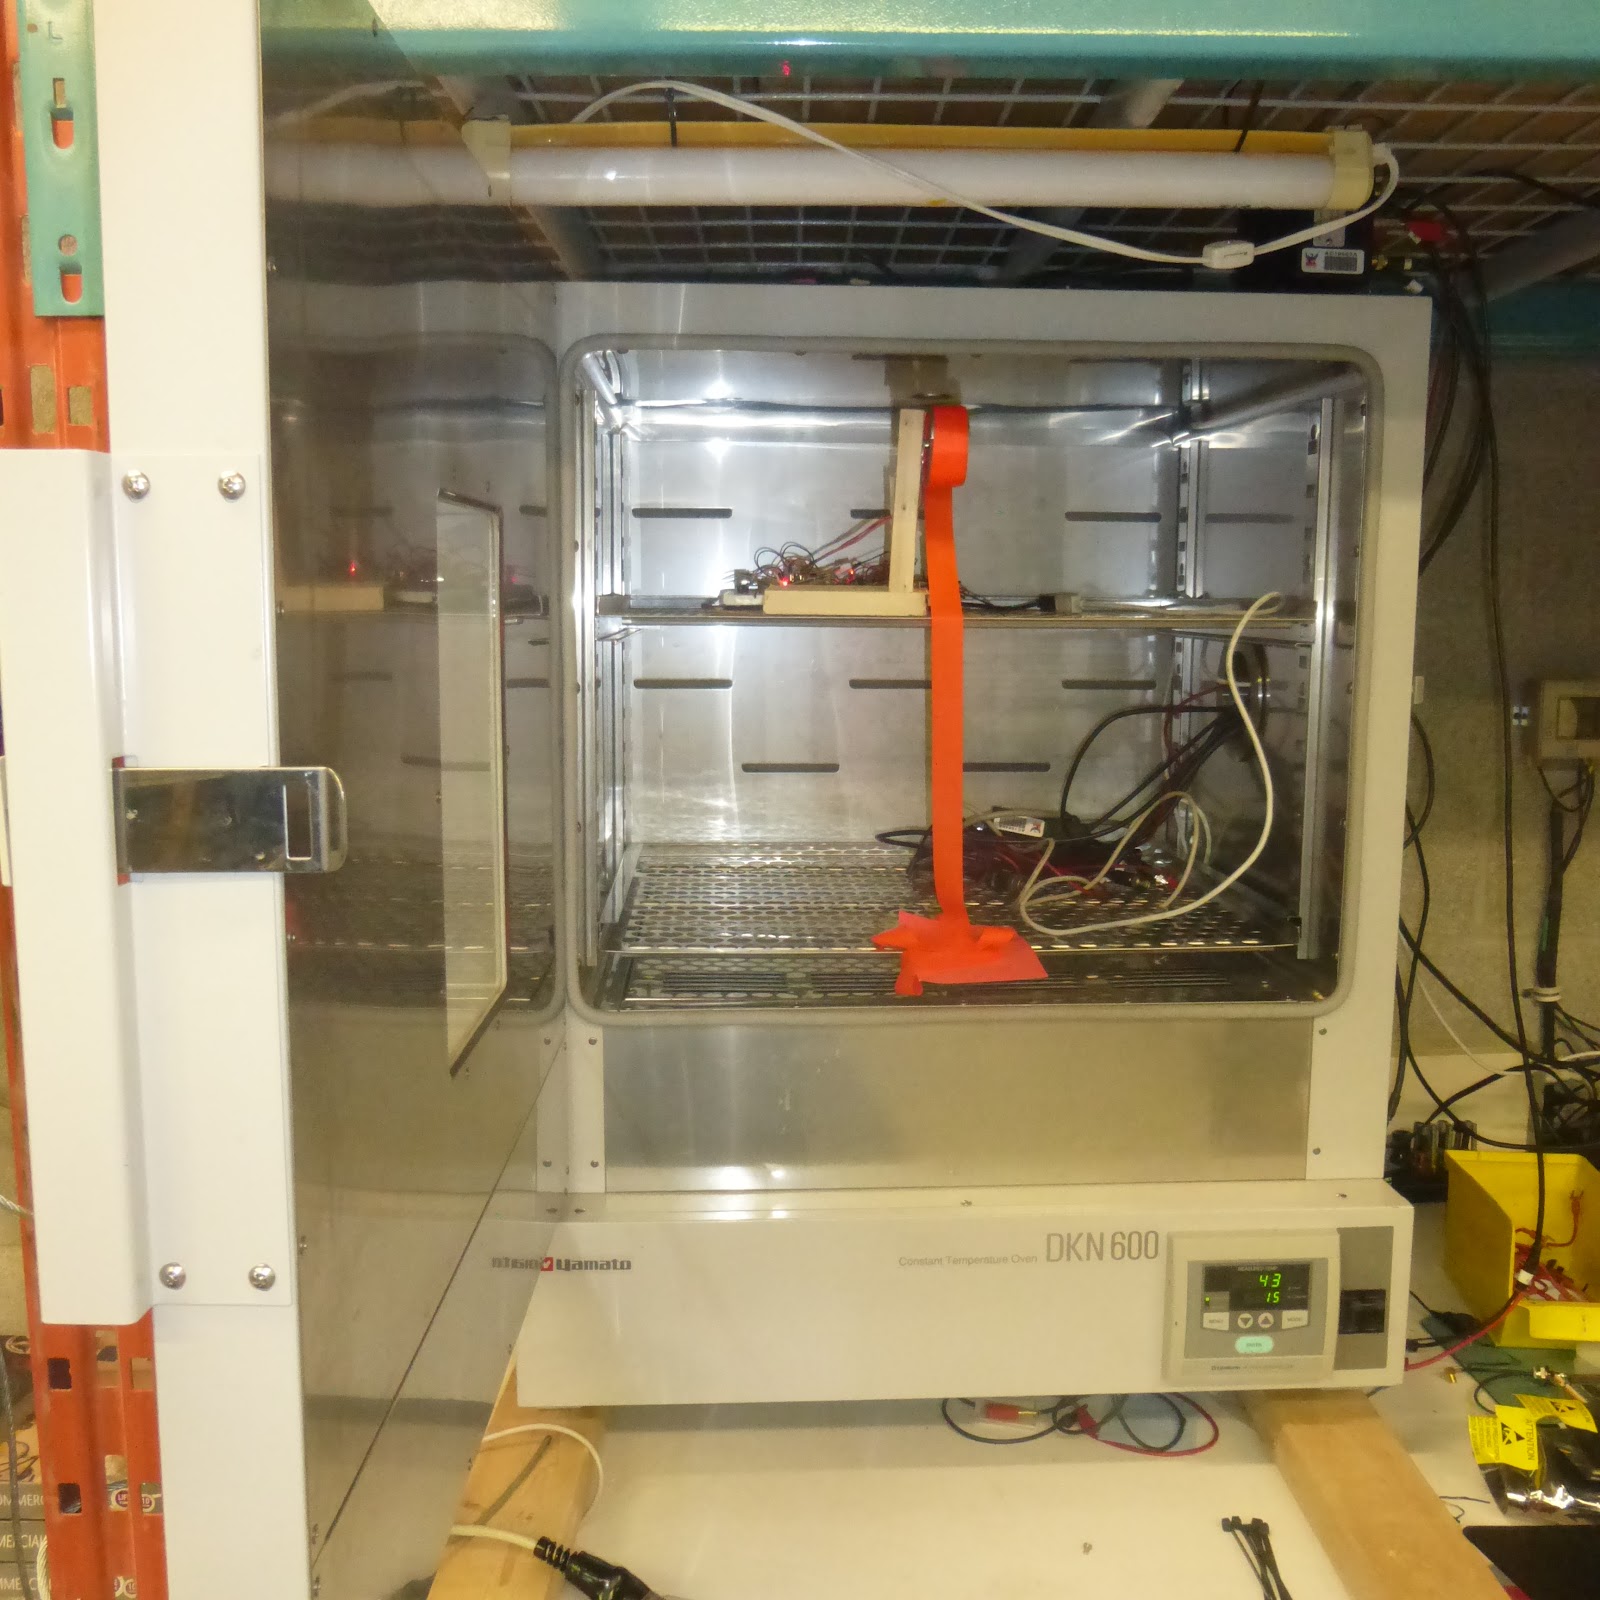
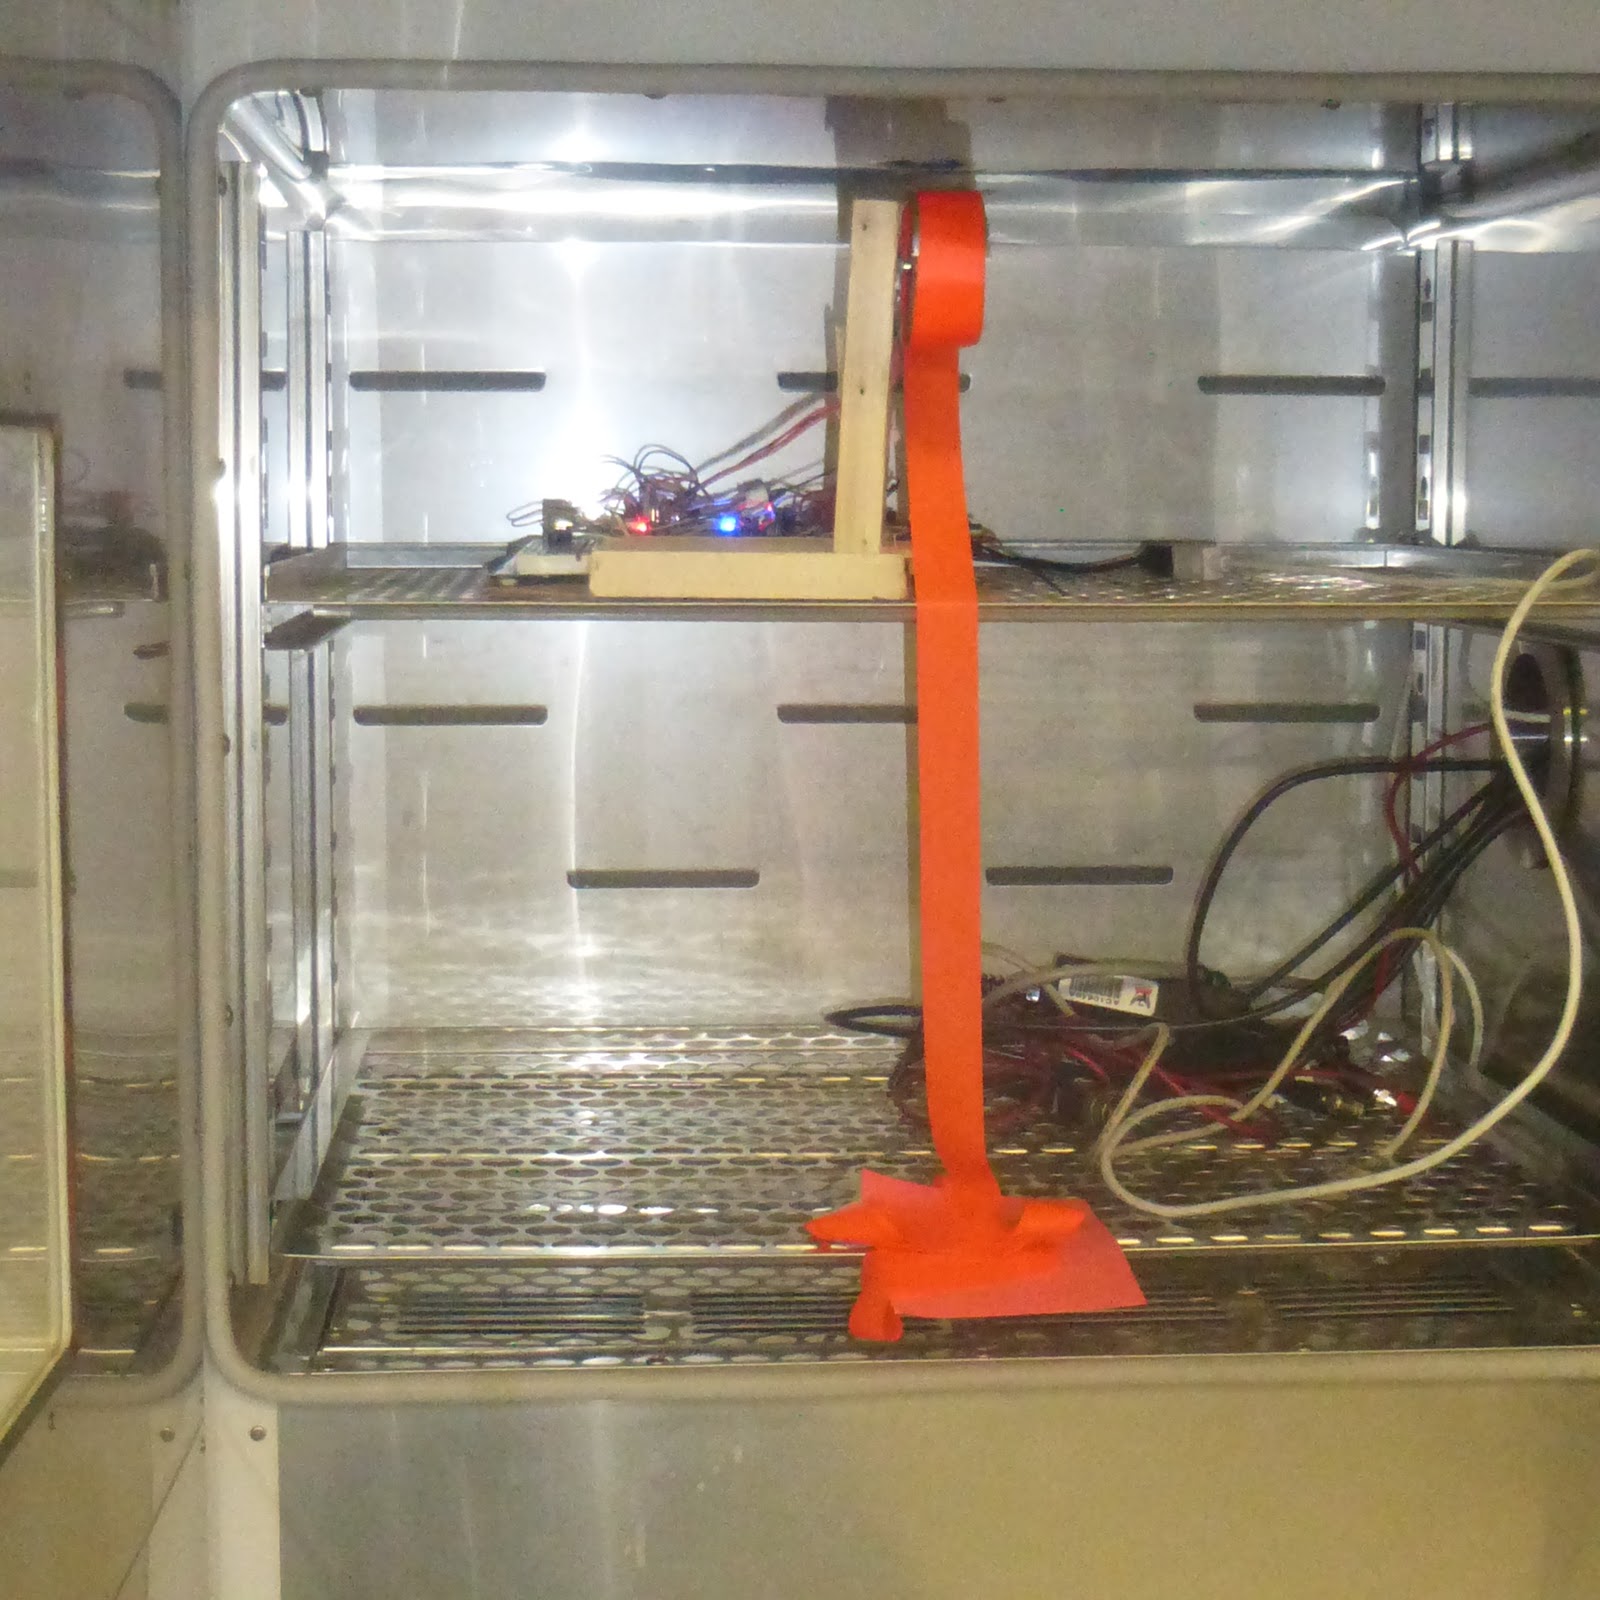
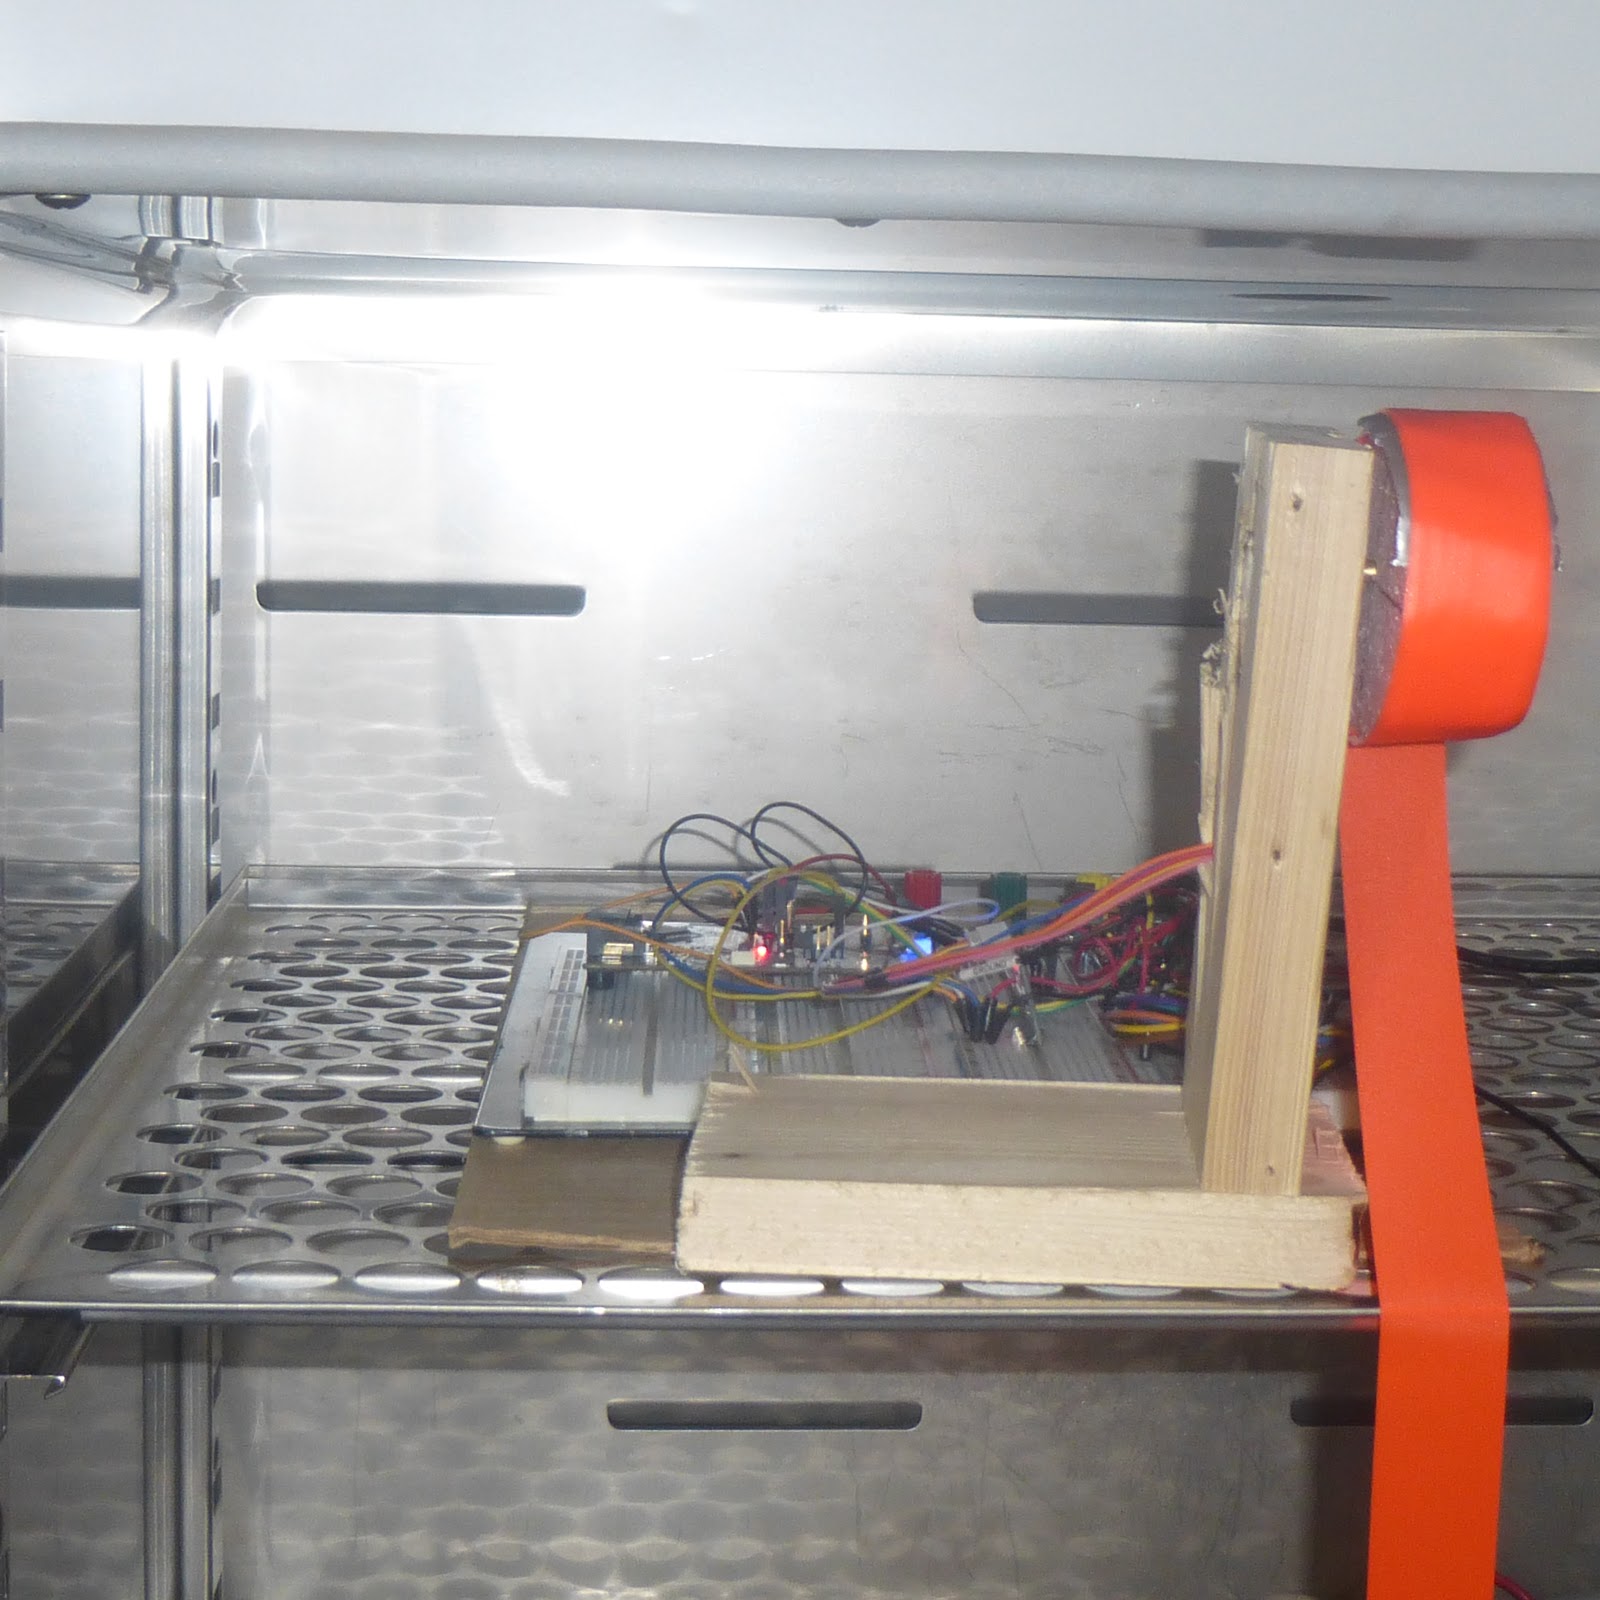
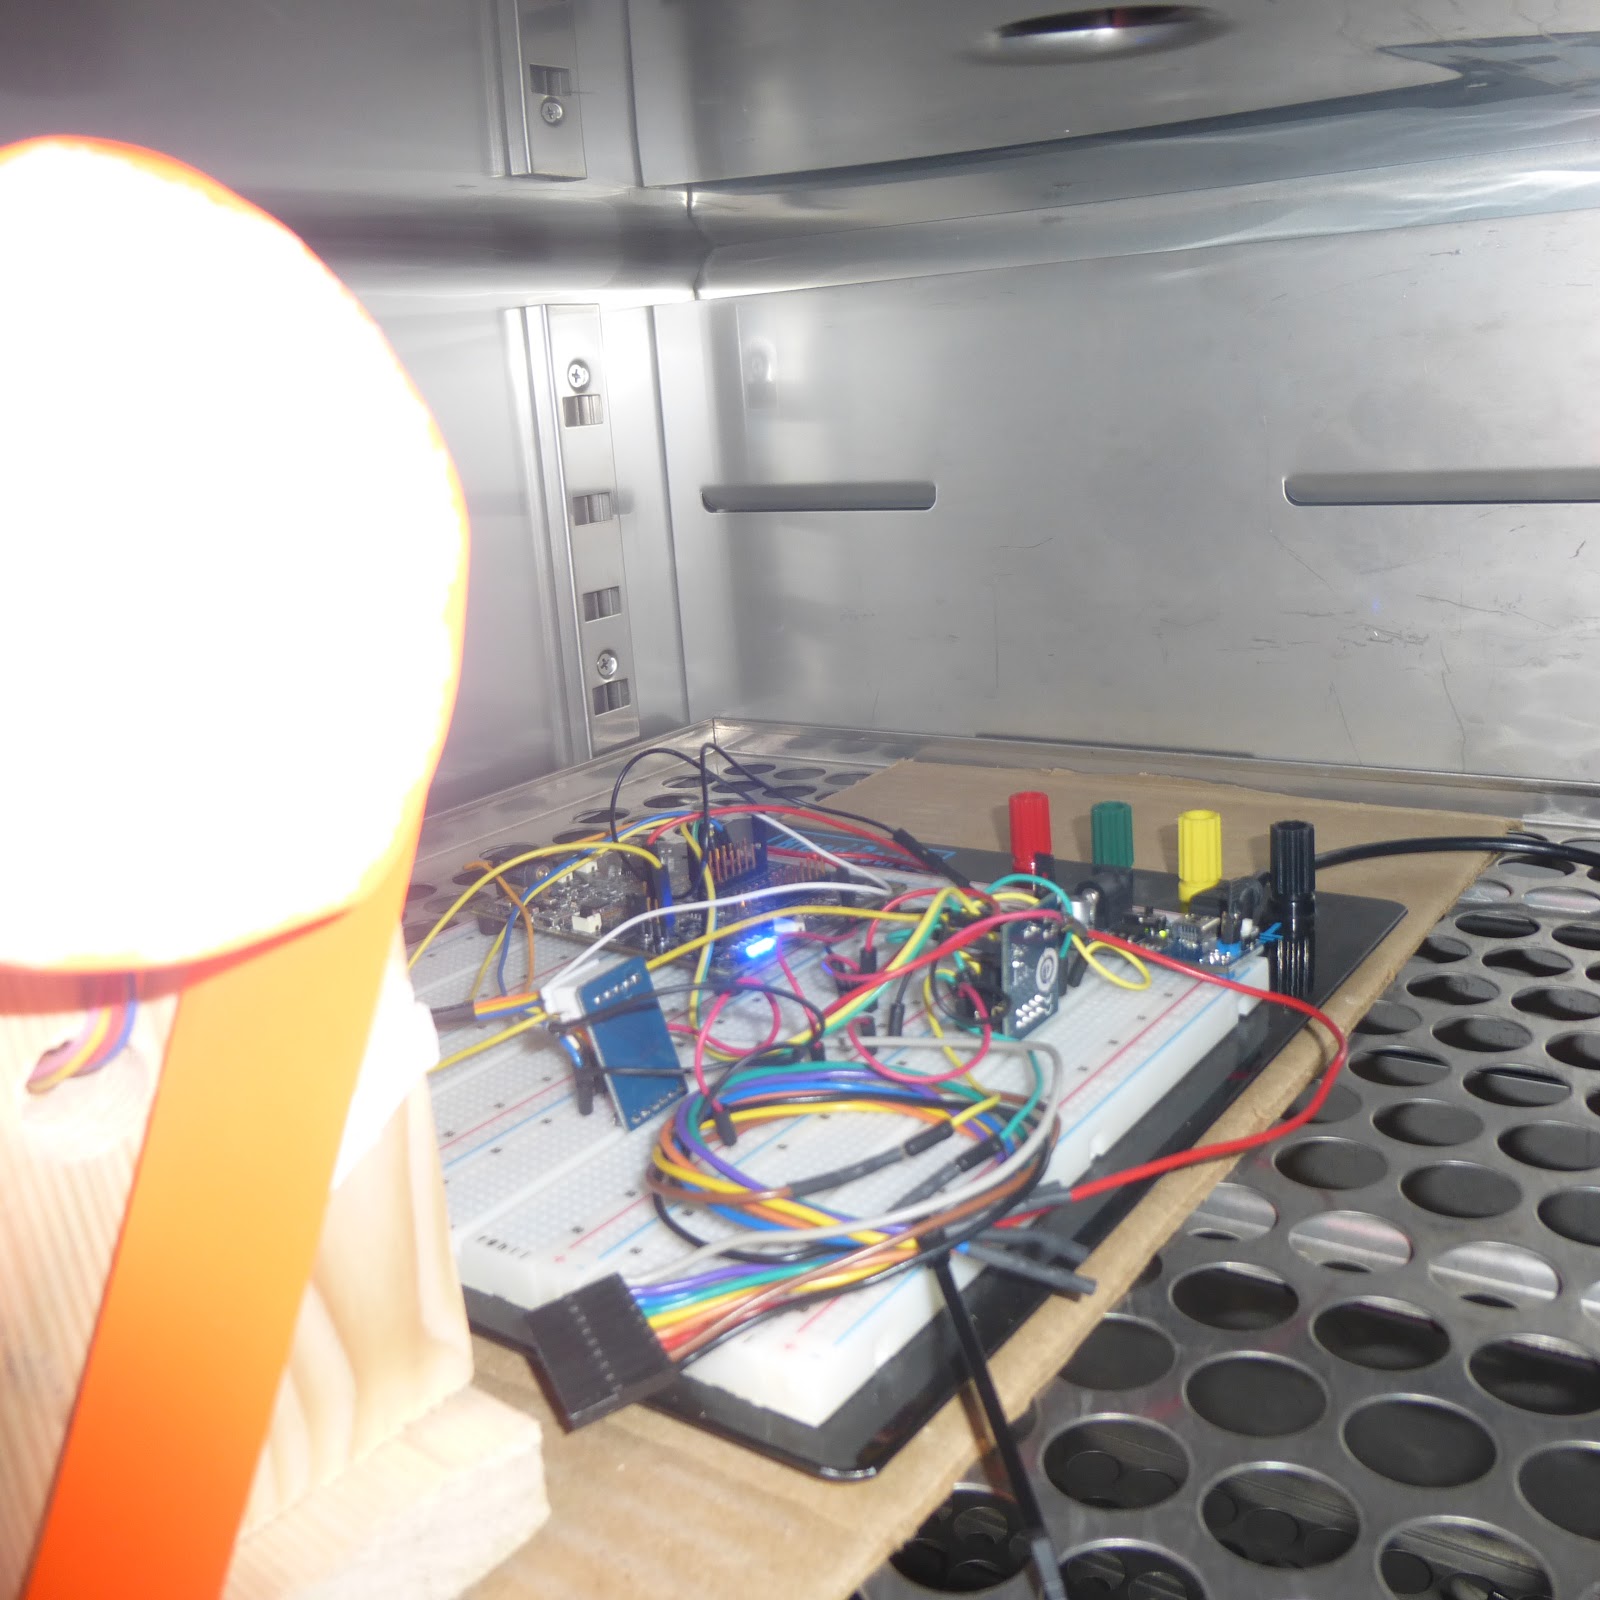
Upon completing this first stage the system was tested in thermal chamber. The chamber was set to 65 ℃ although the critical temperature is set to 50 ℃. This was done to speed up the testing since while the chamber may register 65 ℃ the air inside takes a while longer to reach the set temperature. Figure 5 below shows the thermal chamber as well as the system inside.


Figure 5. Thermal Chamber with System inside


Figure 6. System in Thermal Chamber Resting on Cardboard to Insulate the Two Systems

The full system test can be seen in the video below. As expected when the system reaches the critical temperature the “window” rolls down. The video shows this test being performed once but the actual test was completed several times to ensure repeatability.


While not shown in the video, this test was performed a few times in close succession again to ensure the system could handle a modest cycling of the surrounding temperature.

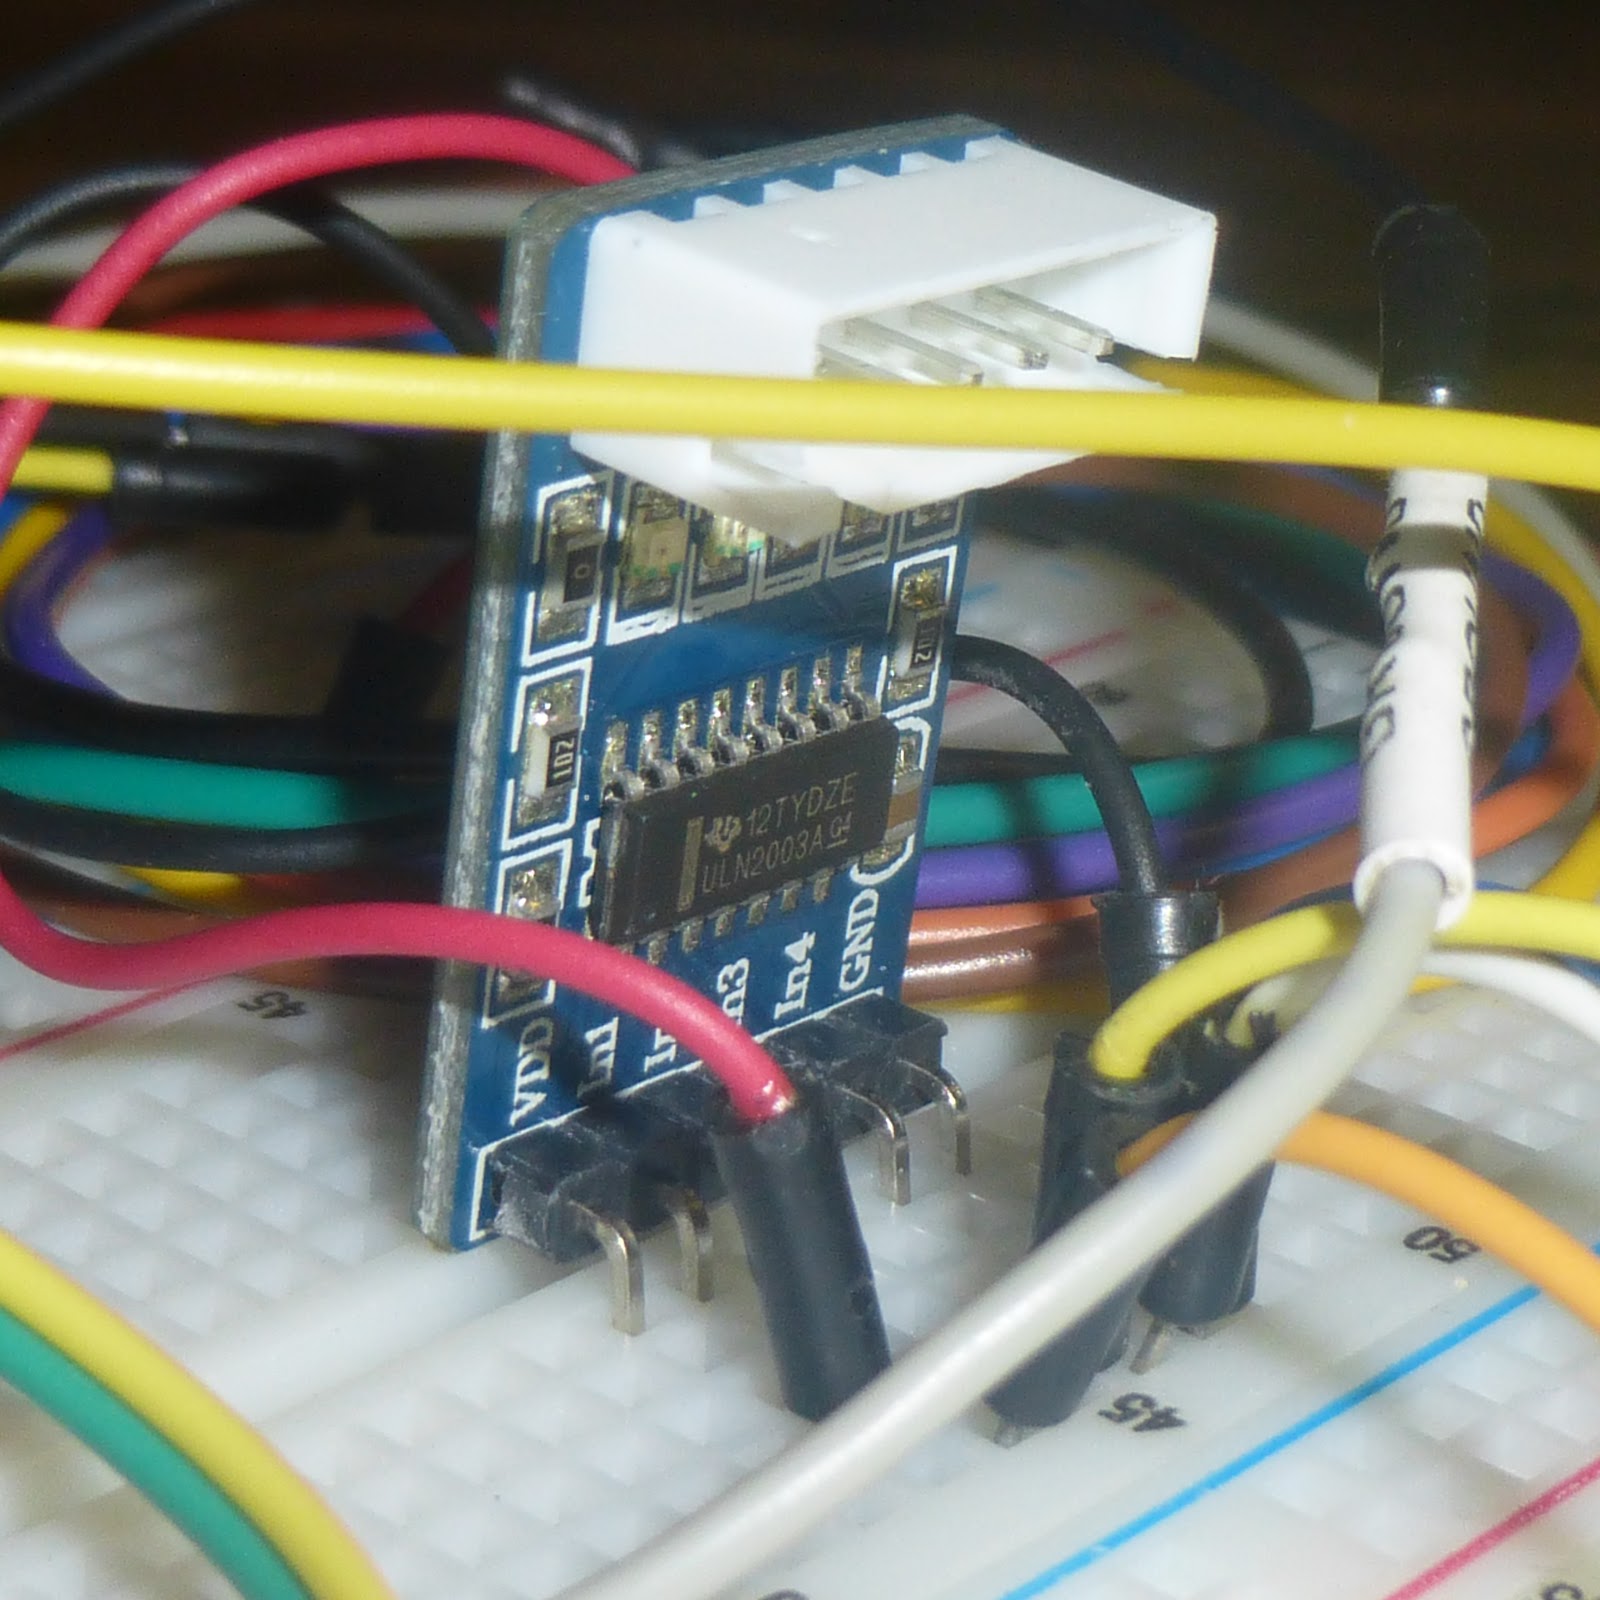
Figure 7. ULN2003 Arlington Array Used to Control the Stepper Motor


System Issues (KEA64)
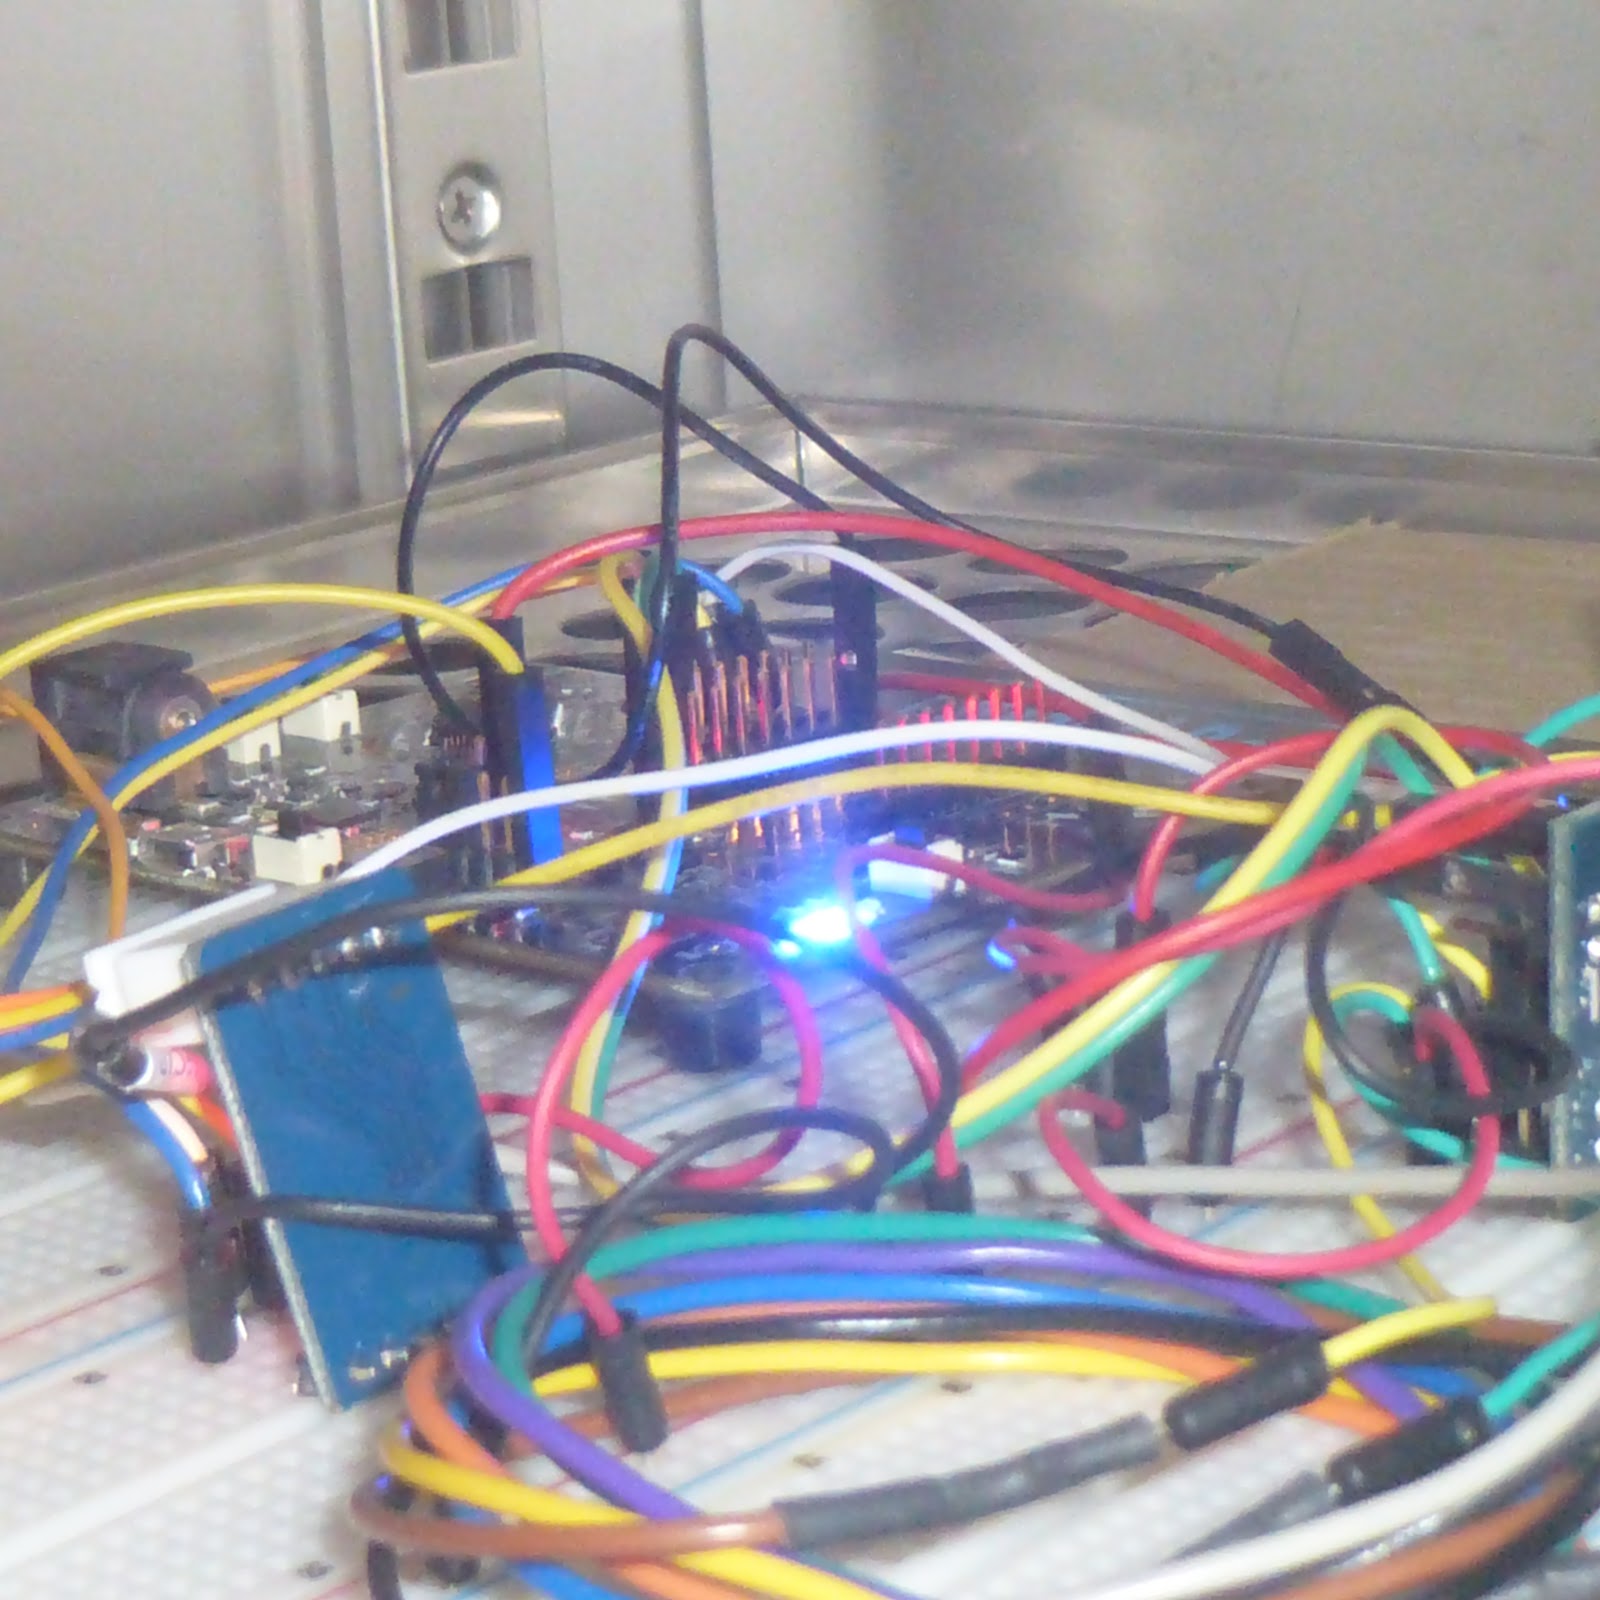
During testing, with both the hair dryer as well as in the thermal chamber, it was noticed that the KEA64 had an unusual and unexpected behaviour at some points. This was evidenced by the LEDs turning on when nothing had happened. With the hair dryer this was witnessed when the hair dryer was initially turned on but not near the unit. In the oven, as can be seen in the video below, it happened when the oven was turned on.


It was not possible to reliably reproduce the issue with the hair dryer, however, with the thermal chamber it was reliably reproduced three times as seen in the above video. Each time the issue was reproduced, it was only when the chamber was turned on, having an initial large power draw, but never when the chamber was being turned off. The few times it did occur with the hair dryer it was also only when turning on the hair dryer.

While further testing needs to be conducted to better understand the issue, there are a few similarities between the two situations which leads to some initial thoughts. In both cases the power outlet is shared by the KEA64 system and either the hair dryer or thermal chamber. With the hair dryer the KEA64 was powered from a laptop that was sharing the same outlet and with the Thermal chamber the USB power supply was plugged in the same outlet as can be seen in figure 8. In the case of the hair dryer and the laptop it may be though that the power supply as well as the USB subsystem would shield the KEA64 from any negative power effects seen at the outlet. In the second case, with the thermal chamber and the USB charger, again it would be assumed that the charger would provide some form or isolation.  In both cases without proper testing the isolation can not be be guaranteed, perhaps in later testing a battery pack could be used to ensure complete isolation from the power mains.

Figure 8. KEA (Top Right) Plugged into Same Socket as the Thermal Chamber (Bottom Left)

These symptoms have led to the assumption that it is a power issue of some sort and related to the KEA64 and not the ADT7420 generating false interrupts. This is assumed because the motor does not run as it should if it was an interrupt generated falsely by the ADT7420. It is therefore assumed the KEA64 is susceptible to something either EMI or some power disturbance that is causing some bits to be flipped.


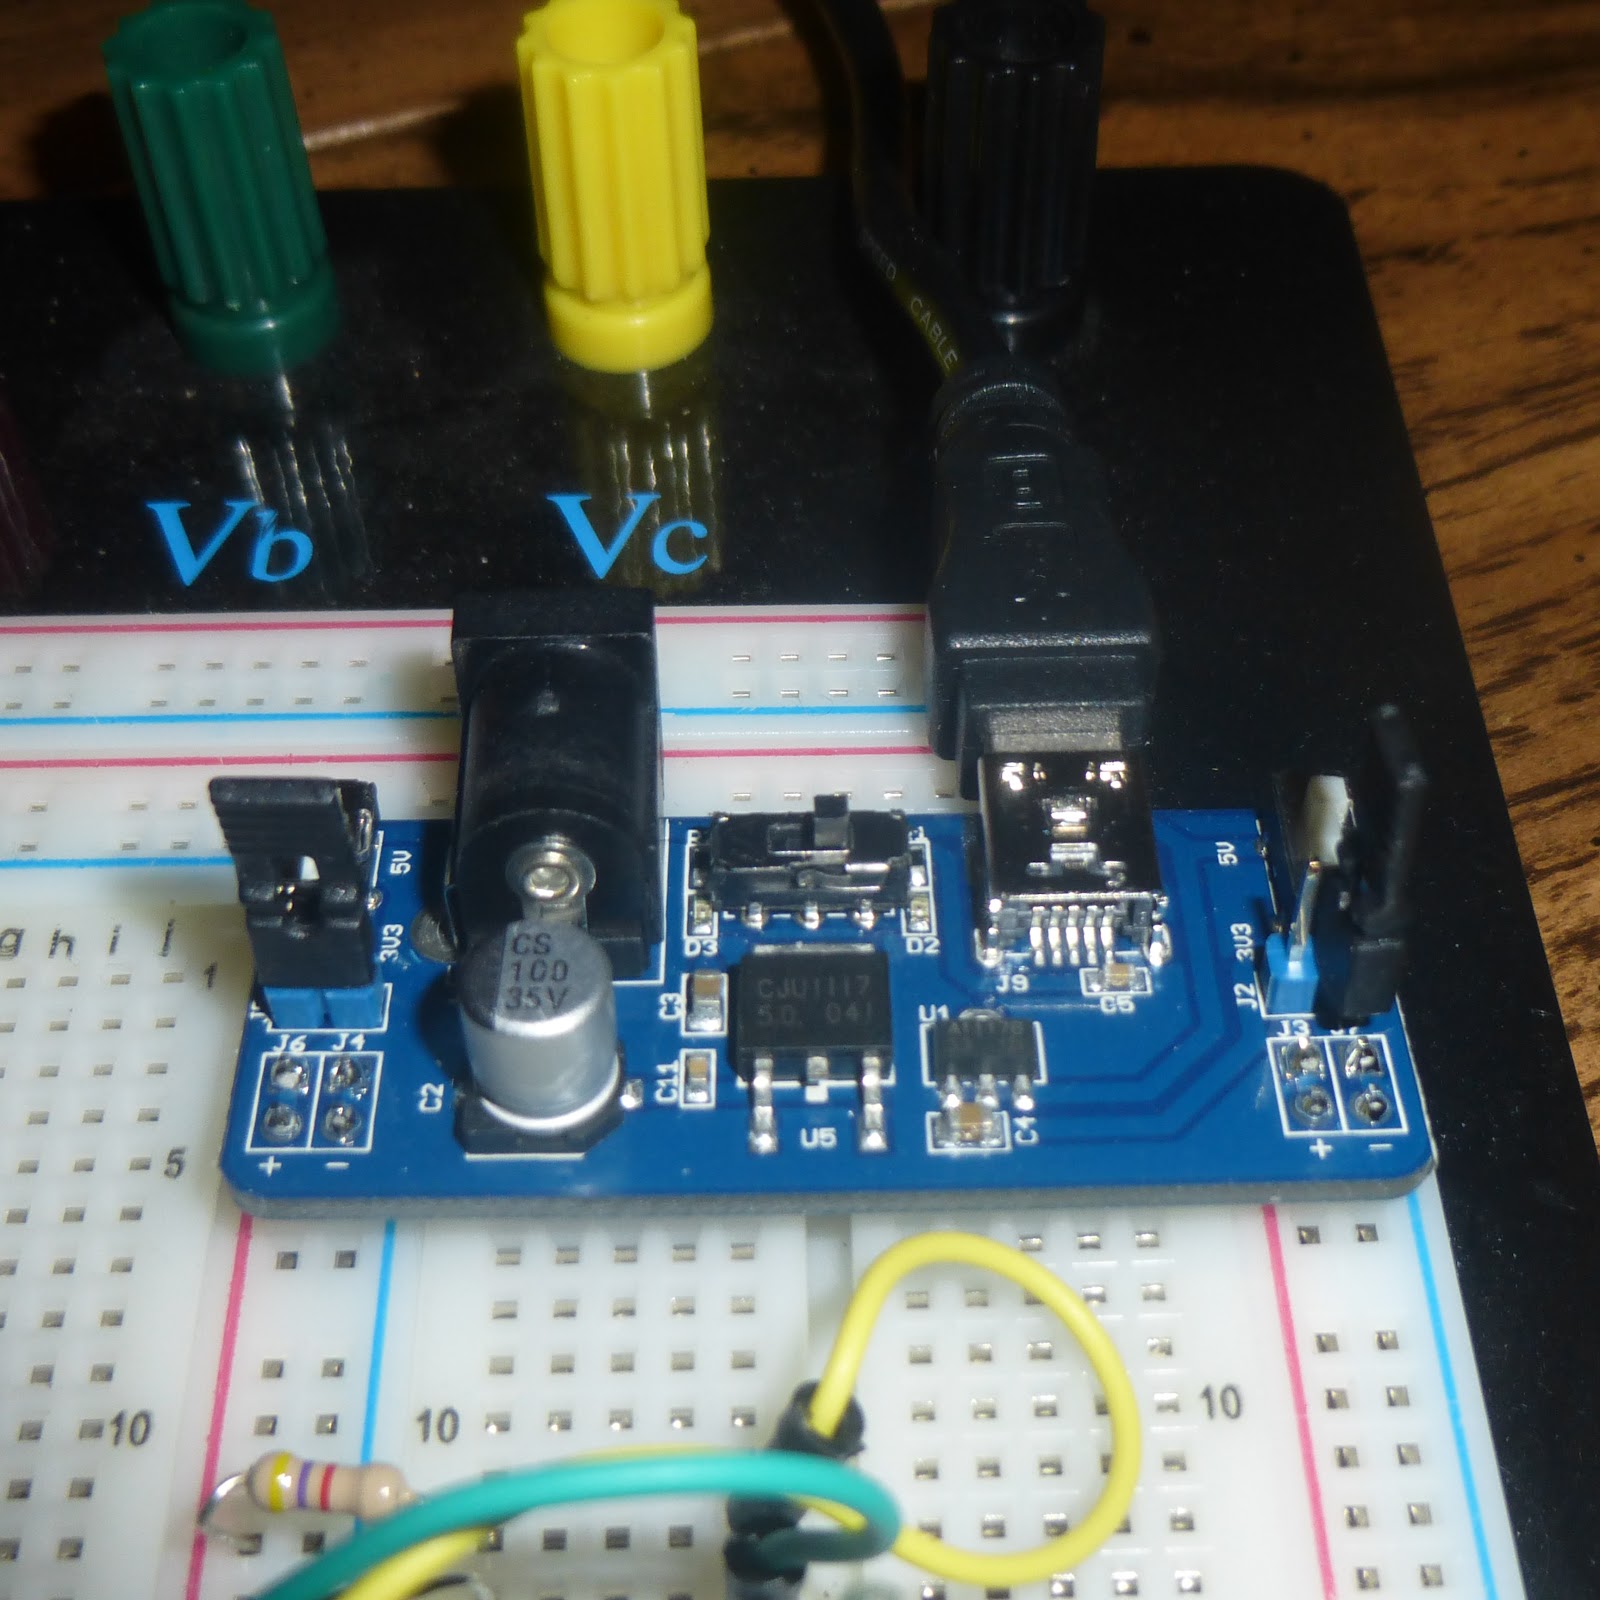
Figure 9. Power Supply Used to Power the System During Thermal Chamber Testing


Figure 10. LEDs on KEA64 Lit Showing Some Issue & the Breadboard Isolated from the Chamber with Cardboard

Moving Forward
The next steps for this project would be to attempt to control the windows in a car via the CAN bus. As these commands are not published this will require some reverse engineering. The CAN bus will be accessed via the OBD port as this is the the easiest and most convenient access point but this may provide other issues. Some ODB ports do not allow all messages to be transmitted to the CAN bus but rather only those needed for diagnostics. Another issue is controlling the windows when the car is off. In this case it would be needed to turn on the electronic subsystems of the car in order to power the windows. Each one of the issues pose their own challenges and will hopefully be dealt with to accomplish the end goal of this project.


Original post on Element14 can be found here
Wednesday, September 24, 2014

Sending Atmospheric Data from the MSP430 and CC3100 Wi-Fi BoosterPack to Plot.ly


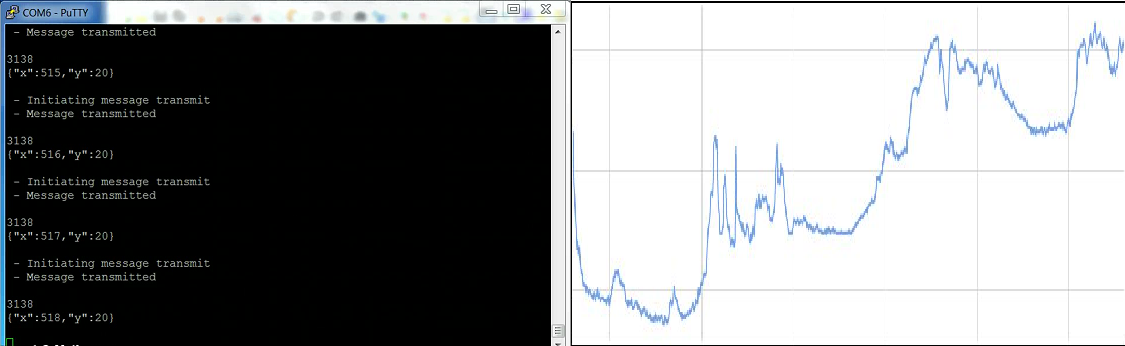
Figure 1. Terminal screen displaying live data being transmitted and demo Plot.ly graph

For a while now I have been thinking about the ability to remotely monitor what is going on environmentally in a location. I have thought about this with regards to the summer, with a cottage more than an hour away it would be nice to know what the weather pattern is for the cottages location (not the general city or county) to decide if it is worth the long drive. I have also thought about this with regards to parts of my house, such as the attic, basement etc, to help determine how well the insulation is working or what is going on in parts of the house where people may not often frequent. Lastly it has come up in many conversations with storekeepers who want to know how their fridges are performing and to know when there may be an issue. With all these usage cases I decided I should come up with a solution.

When TI came out with their CC3000 I thought I would give that a try. I spent a few weeks working with this BoosterPack in conjunction with a Stellaris (Tiva C) and MSP430G2553  launchpad but had a good few issues that just didn't seem easily resolvable as well as some limitations that hinder the usability of the system, besides by then TI had come out with the CC3100 that was supposed to resolve a lot of issues as well as be some what easier to use.
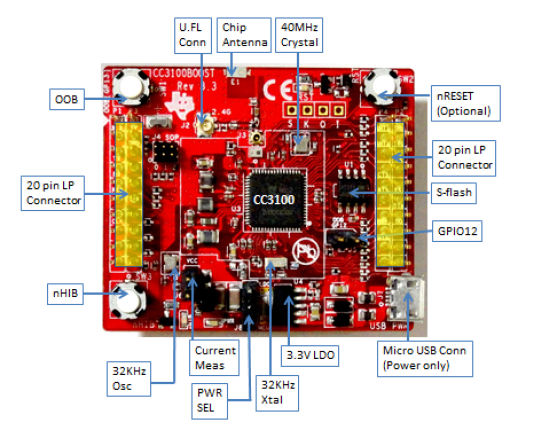
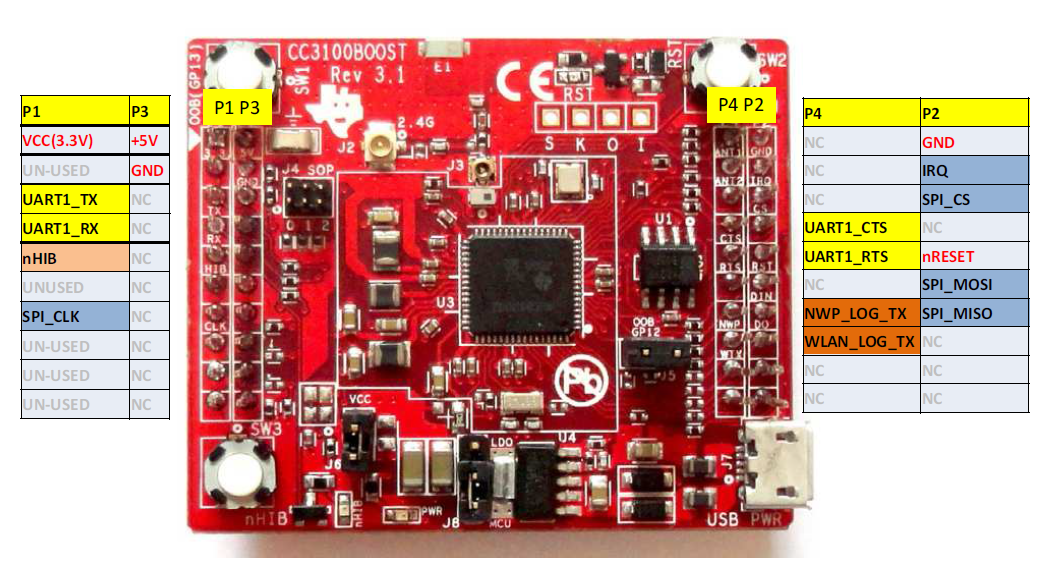
Figure 2. CC3100 layout and pin assignment

At the same time I was introduced to Plot.ly, an online graphing tool that allows for real time plotting of almost any form of data. After looking over how Plot.ly works I decided these two tools together would make a good start to resolving my real time remote data logging problem.

As I have a decent background with TI devices the use of TI products was a natural and convenient choice.The MSP430F5529LP was chosen as the brains behind the system and as previously stated the CC3100  was chosen for the Wi-Fi connection. The MSP430F5529LP was chosen do to the wide availability of example code and wide usage of this launchpad with the CC3100.
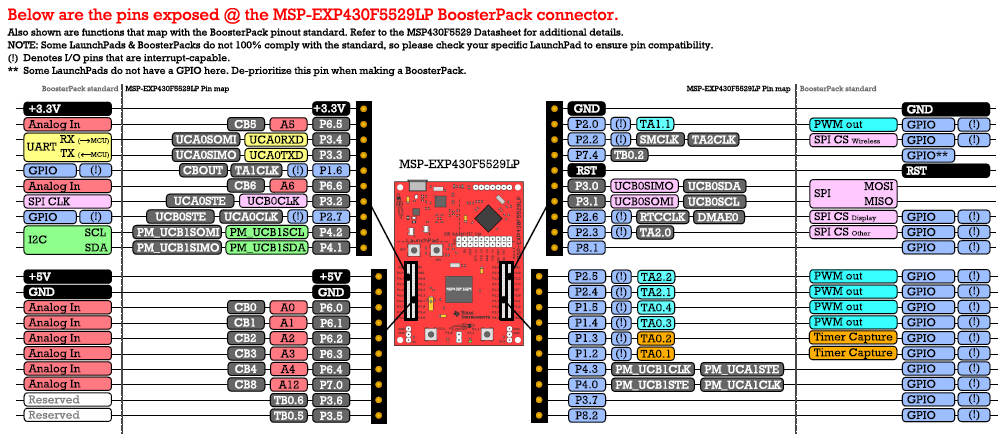
MSP-EXP430F5529LP_QSG_PinOut.png
Figure 3. MSP430F5529 pin assignment for use with BoosterPacks

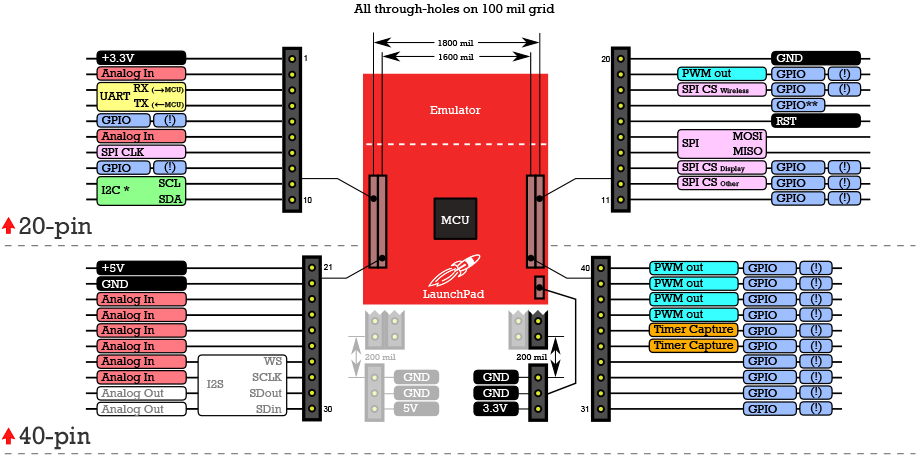
The Wi-Fi connection is a CC3100 Boosterpack that contains an integrated TCP stack and is interacted via SPI. One of the important features about this BoosterPack is its conformity to the BYOB (build your own board) standards.

Figure 4. Build Your Own Board pin assignment layout

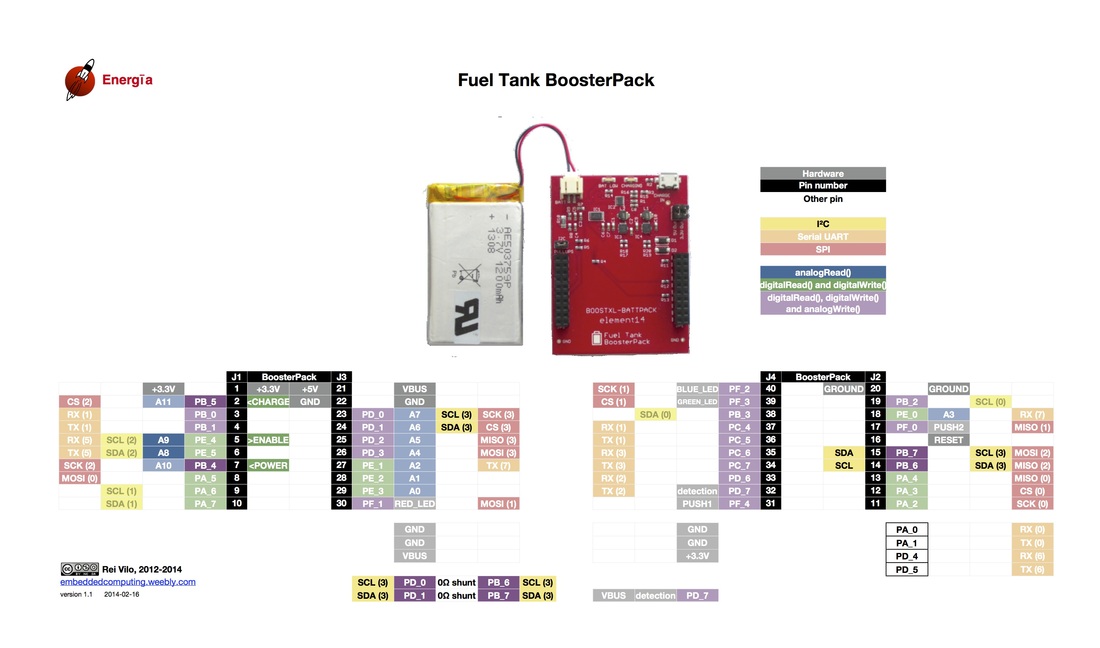
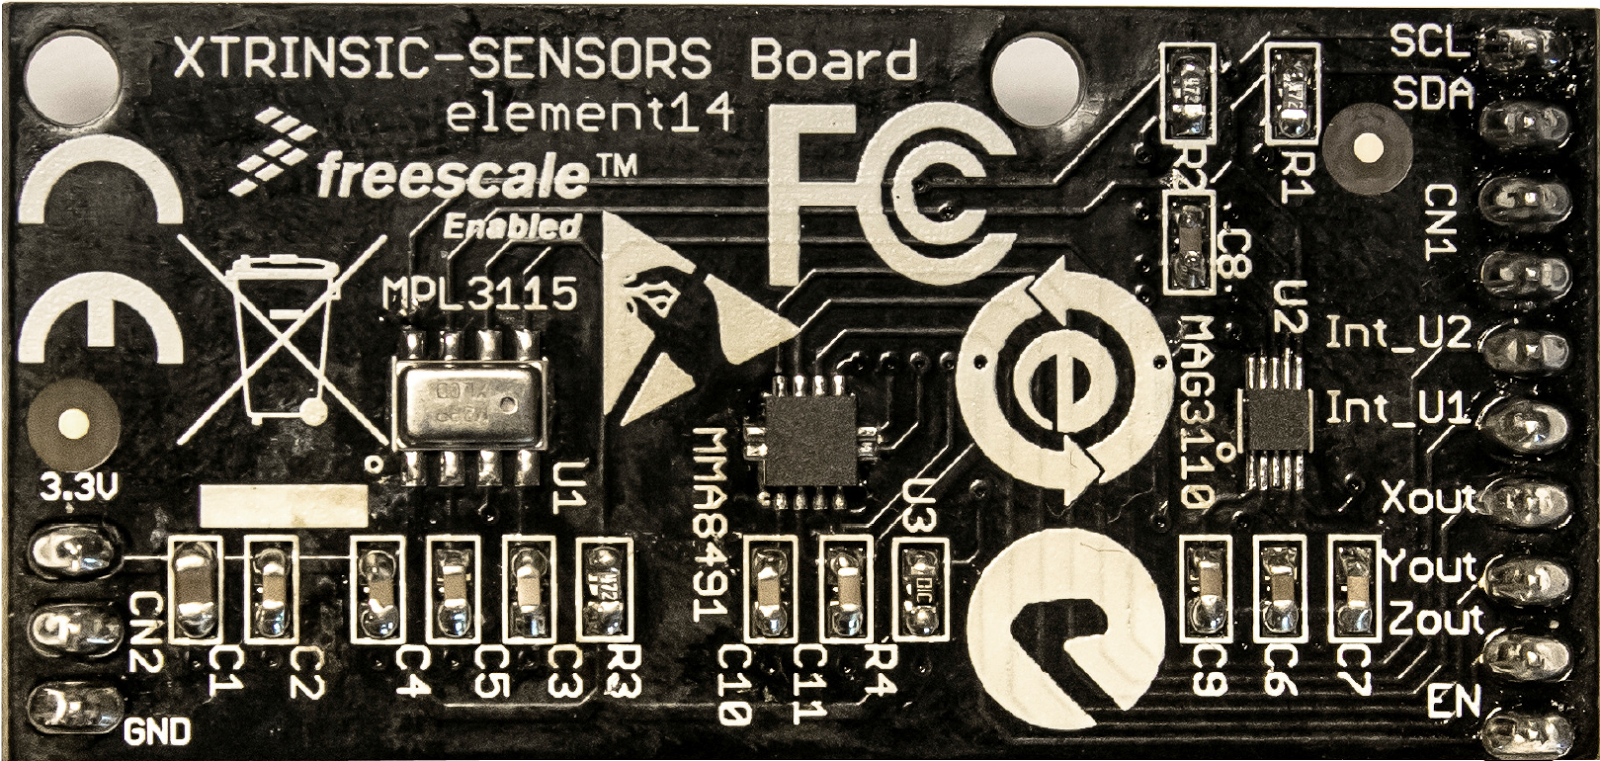
This means that all the pin connections are in predetermined locations allowing for ease of use with other BoosterPacks. The sensor chosen is a MPL3115A pressure sensor from Freescale and was integrated using the Xtrinsic sensor board from Element14 and Freescale. Lastly as this needs to be able to work in a remote location I decided to add a local power source, for this the Fuel Tank BoosterPack from Element14 was chosen. This choice however does present its own issue. The Fuel Tank BoosterPack does not conform to the BYOB standard. With some connections in contention this board was connected via jumper leads and for now only provides power, the power monitoring ability of the BoosterPack has not been implemented but hopefully will be in a later iteration of this project.


Figure 5. Fuel Tank BoosterPack pin assignment (non-conforming)


The project is based on the TCP_Socket demo for the CC3100. This demo has the basics needed to connect to an access point (AP), open a socket and send data, this provides a very substantial start for the project. This code was modified one step at a time. The first step was to allow for data of my choosing to be transmitted. This was tested and verified using a piece of software from HW-Group called Hercules. This software allows you to have a server running on your PC and to easily receive and see incoming data. One this was done the code needed to be further modified to allow for one connection to be made and multiple packets of data to be transmitted. This was done by splitting the BSDclient function into two distinct functions. The first function would take care of creating a socket and connecting to it. The second function packetTx would then take care of transmitting the desired data. Once this was done (with some difficulty, see forum posts for details), it was time to start transmitting data to Plot.ly.

The website for Plot.ly origanly did not provide a lot information if you were not using one of there standard platforms (Arduino, Matlab, etc) or one of there chosen languages (Python, R, Arduino), I therefore had to take the Arduino code (the easiest to understand) and parse it so it could be used in the format needed by the CC3100. From this code (Plotly’s Arduino code) I was able to create a graph using the REST API commands. These commands in their most basic form look like this:

POST /clientresp HTTP/1.1
Host: 107.21.214.199
User-Agent: MSP430F5529/0.5.1
Content-Length: 243
where the IP address “107.21.214.199” is the address of Plot.ly. The content length is the length of the following string in bytes that actually creates the graph (Note each line is terminated with a carriage return as well as a new line (“\r\n”)):

version=2.2&origin=plot&platform=Stellaris&un=Kas&key=ABCDEFGHI&args=[{"y": [], "x": [], "type": "scatter", "stream": {"token": "1234567890", "maxpoints": 500}}]&kwargs={"fileopt": "overwrite", "filename": "test plot", "world_readable": true}

I will explain this string briefly. Platform is the platform or language being used, from what I can tell changing this has no effect on how the graph behaves. “un” is the username, mine is Kas. “key” is your unique identifier key that allows access to your account. “args” is used to set up the individual traces, in this case I have only one trace so there is only one set of args. if you wanted more than one trace you would use something like this:

version=2.2&origin=plot&platform=MSP430F5529&un=Kas&key=ABCDEFGHI

&args=[{"y": [],"x": [],"name": "Temperature","type": "scatter", "stream": {"token": "1234567890", "maxpoints": 500},"yaxis":"y1"}, {"y": [],"x": [],"name": "Pressure","type": "scatter", "stream": {"token": "1a2b3c4d5e", "maxpoints": 500}, "yaxis": "y2"}]

&kwargs={"filename": "Temperature and Pressure", "fileopt": "overwrite", "style": {"type": "scatter"}, "layout": {"title": "Temperature and Pressure vs. Time", "xaxis": {"title": "Time (s)"}, "yaxis": {"title": "Temperature (Celsius)"}, "yaxis2": {"title": "Pressure"}}, "world_readable": true}


for a full listing of commands you can look at this documentation. “kwargs” is the settings for the overall graph such as the title, public/private access as well as others. At this point I had a graph created and was able to see it in my workspace on the Plot.ly website. I now needed to stream data, using the Arduino code for this however did not appear to help very much. I will again show the commands to open a stream and stream data and then explain them.

POST / HTTP/1.1
Host: stream.plot.ly
User-Agent: Python
Transfer-Encoding: chunked
Connection: keep-alive
plotly-streamtoken: 1234567890

In this code the main command that you need to edit is “plotly-streamtoken”. This line is used to specify the specific trace that this data should be posted to, it is the same as the token in the args passed to create the graph. Note each line is terminated with a carriage return as well as a new line (“\r\n”). Once the stream is open data can be sent to tos graph and trace specified this is done by the following line:

3134
{"x":1,"y":5}
3134
{"x":2,"y":5}

This is where it gets confusing, the 3135 appears to be meaningless but is is infact hex for 14. There are 14 bytes transmitted here including a new line. The “X” value here can be seen to be 1, 2 and the “Y” value is 5. The order of the “X” and ”Y” does not appear to matter. Data must be transmitted once per minute or Plot.ly closes the stream, you can choose to reopen the stream (Plot.ly would prefer you don’t consttly open and close sockets) or preferably send a heartbeat (“\r\n”) if it will be longer then a minute before your next data transmission. Now that we can open a connection with Plot.ly using the CC3100, stream data to plot in reat time its time to get the data from the desired sensor.

I chose to use the MPL3115A as it is a relatively simple sensor to use and I had one laying around. The MPL3115A uses I2C to communicate and once set up to take a reading every second there is not much to do other than poll for data. This will eventually be changed to an interrupt based system which would ideally allow for the MSP430F5529LP to sleep for approximately 95% of the time (back of the envelope calculation) increasing the units life by orders of magnitude.

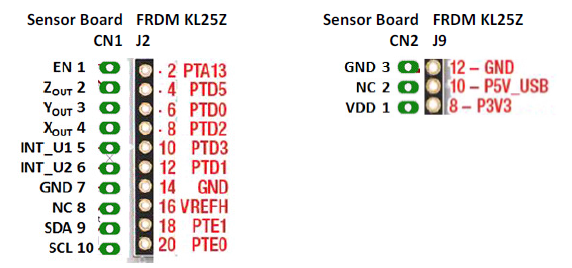
Figure 6. Xtrinsic Sensor Board and pin assignment configuration

This code was initially developed separately from the TCP_Socket code and was slowly merged allowing for issues to be easily resolved. The main issue encountered was the “Error: "Program will not fit into" after adding interrupt handler” this was eventually resolved by simply removing the interrupt handler for “USCI_B1_ISR” in board.c. Once the data is read in it needs to be changed to a string and assembeled as message that Plot.ly can interpret. This is all done in the “plotlyPlotString” function, two integers are passed in as well as a pointer to a char array. The integers are converted to chars and inserted into the string ready to be sent to Plot.ly (this function in its entierty can be confusing so if anyone would like more clarification I would be happy to further exlpain it below). One integrated and tested the system performed pretty well.

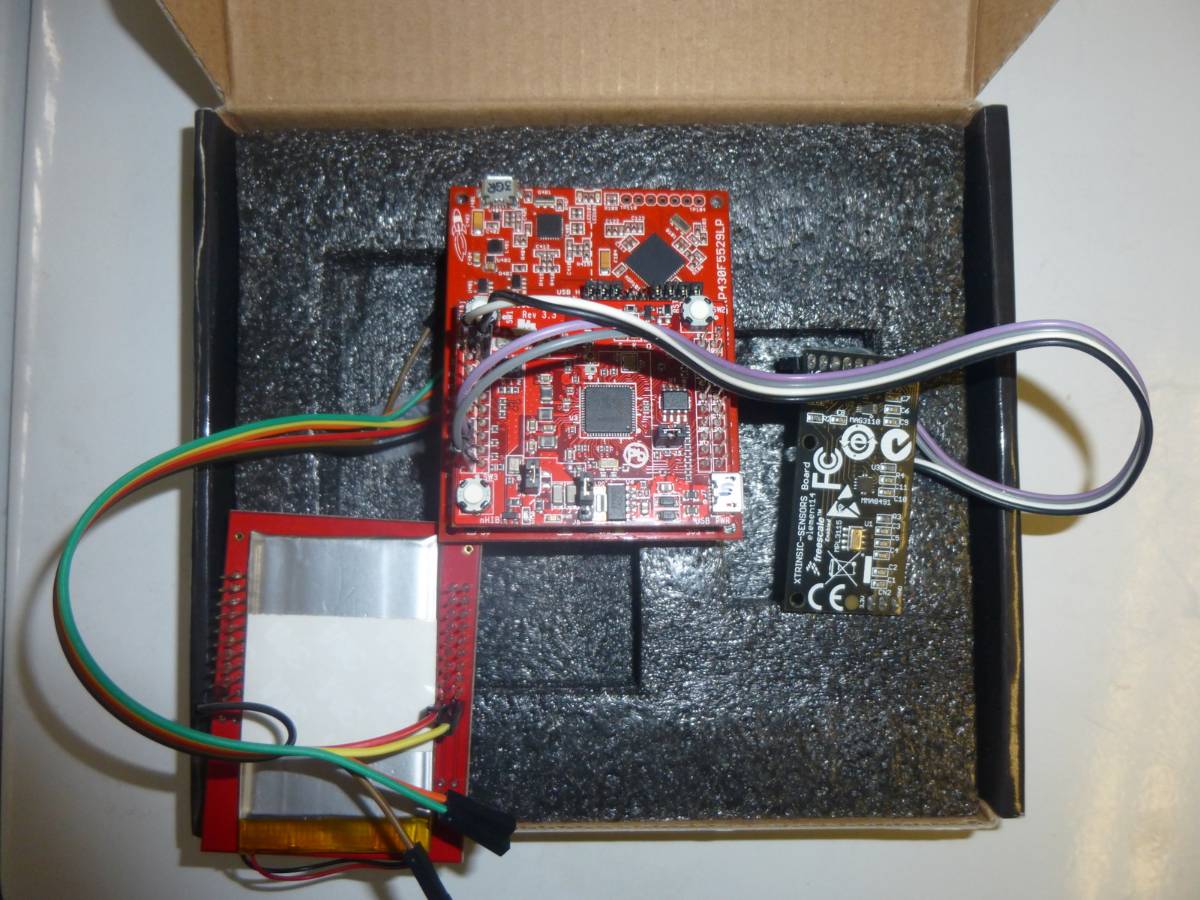
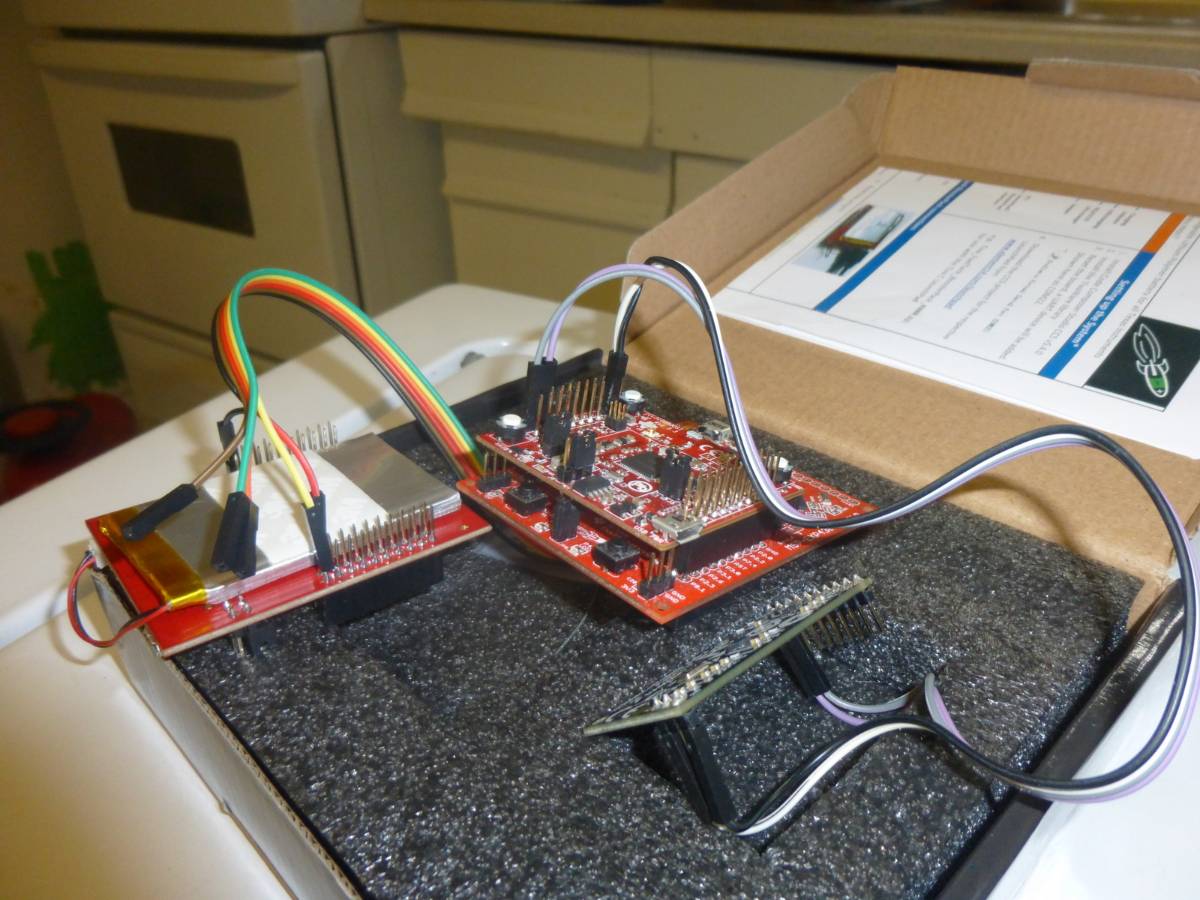
P1010197.JPGP1010203.JPGFigure 7. MSP430F5529 with CC3100 BoosterPack mounted and connected to the Xtrinsic Sensor Board (P4.1, P4.2) and Fuel Tank BoosterPack (3.3V, 5V, GND)

Next Steps
Moving forward there are a number of improvements that need to be made. As of now the system disconnects from Plot.ly after ~530 data points (this does not happen with the Hercules server), this issue will need to be resolved and is currently under further investigation. There is also the issue of inadvertent disconnections from the AP that for a robust system will need to be taken care of, this will involve checking that the connection has not been closed and if it has, to reconnect. There is also the need to check that the socket has not been closed and again if it has to reopen it before continuing to send data. Lastly for complete robutness the system should be able to check for error messages from Plot.ly and react to them in a meanigfull manour.

Besides for these steps the inclusion of pressure data on a separate “Y” axis would allow for a better use of the chosen sensor. Also the full implementation of the Fuel Tank BoosterPack with power monitoring and plotting time remaining, battery voltage and possibly other metrics would be a useful addition.

I will update this post as the project evolves. If you have any questions or comments I would be happy to address them in the comments below.

For those who would like to try this and may run into the same issues I have, I have included a link to the issues I had and how TI helped me resolve each of them

CC3100


Original post on Element14 can be found here