Showing posts with label I2C. Show all posts

Thursday, November 20, 2014

LPRS eRIC Development Kit - Review


p1010278.jpg

I would like to thank Element14 and LPRS for selecting me for this Road Test Review. This was an interesting and fun road test due to my past experience with the Texas Instruments CC3x00 SimpleLink family, LS Research ProFlex Zigbee and Anaren AIR Zigbee modules amongst others. I was very much looking forward at comparing the ease of use of the eRIC modules as well as the range such modules could give.


Unboxing
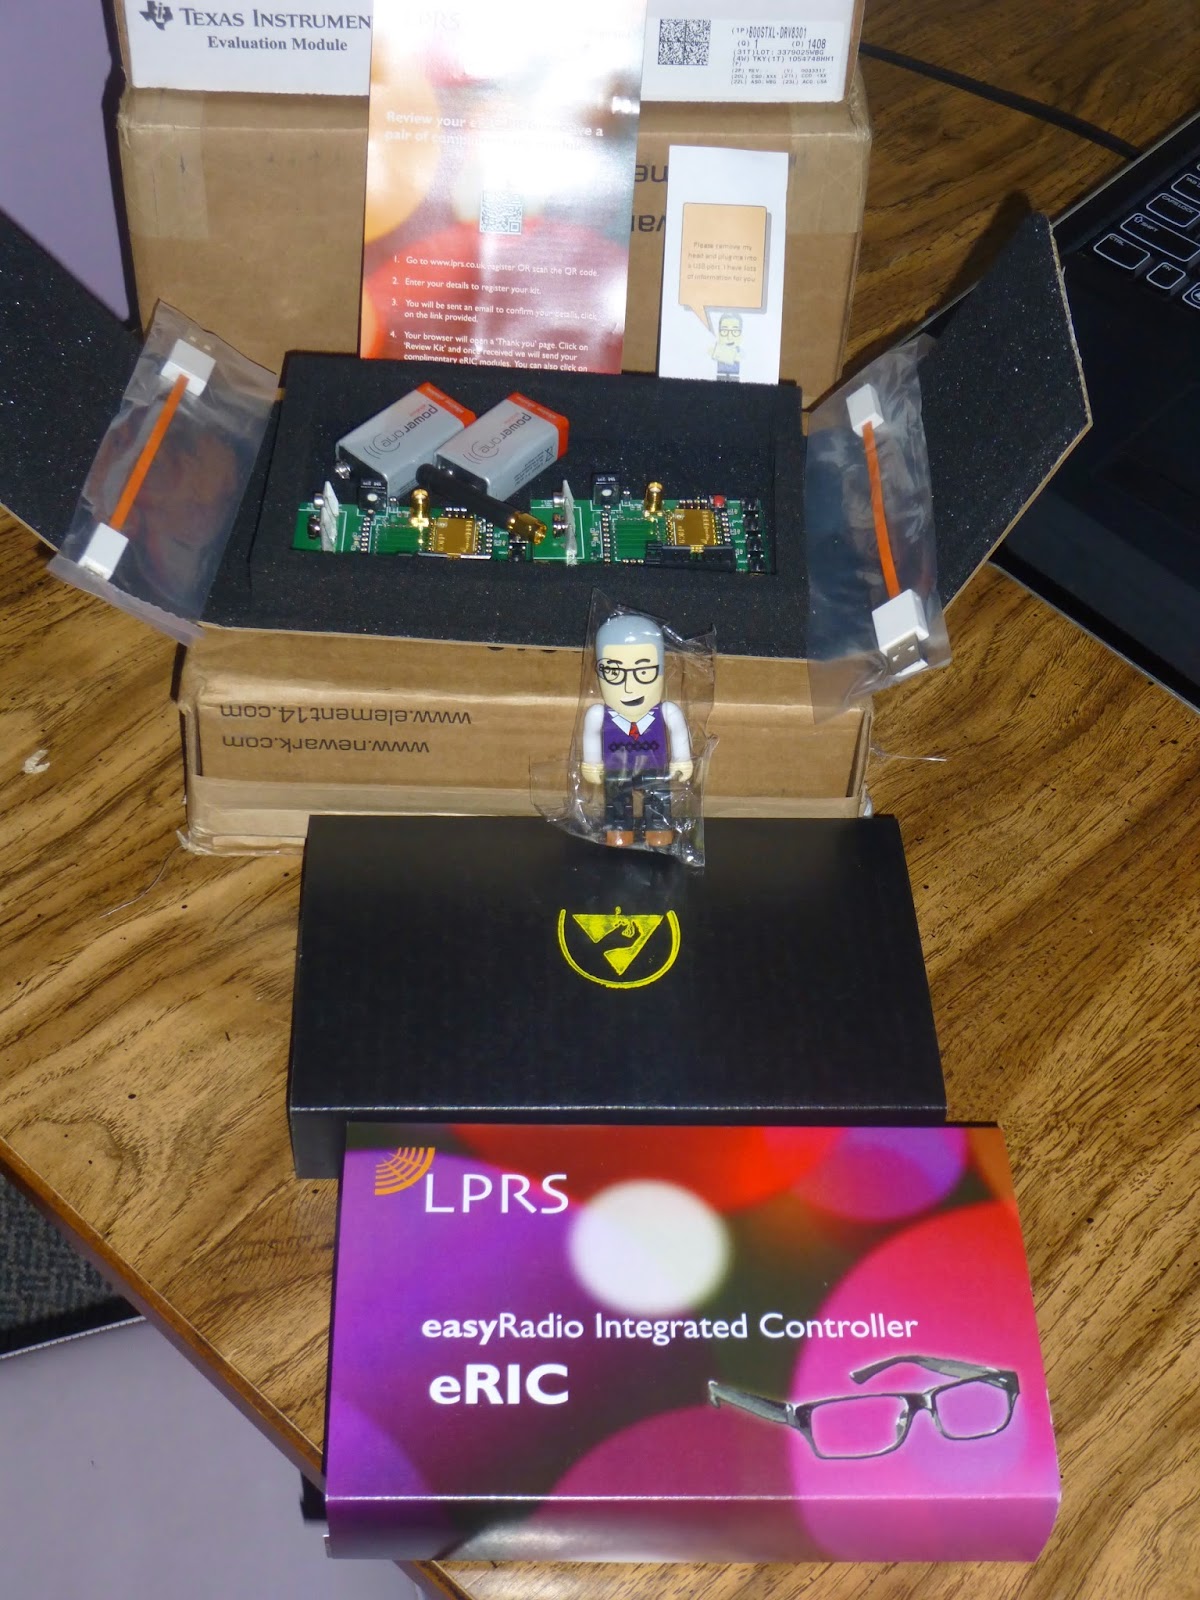
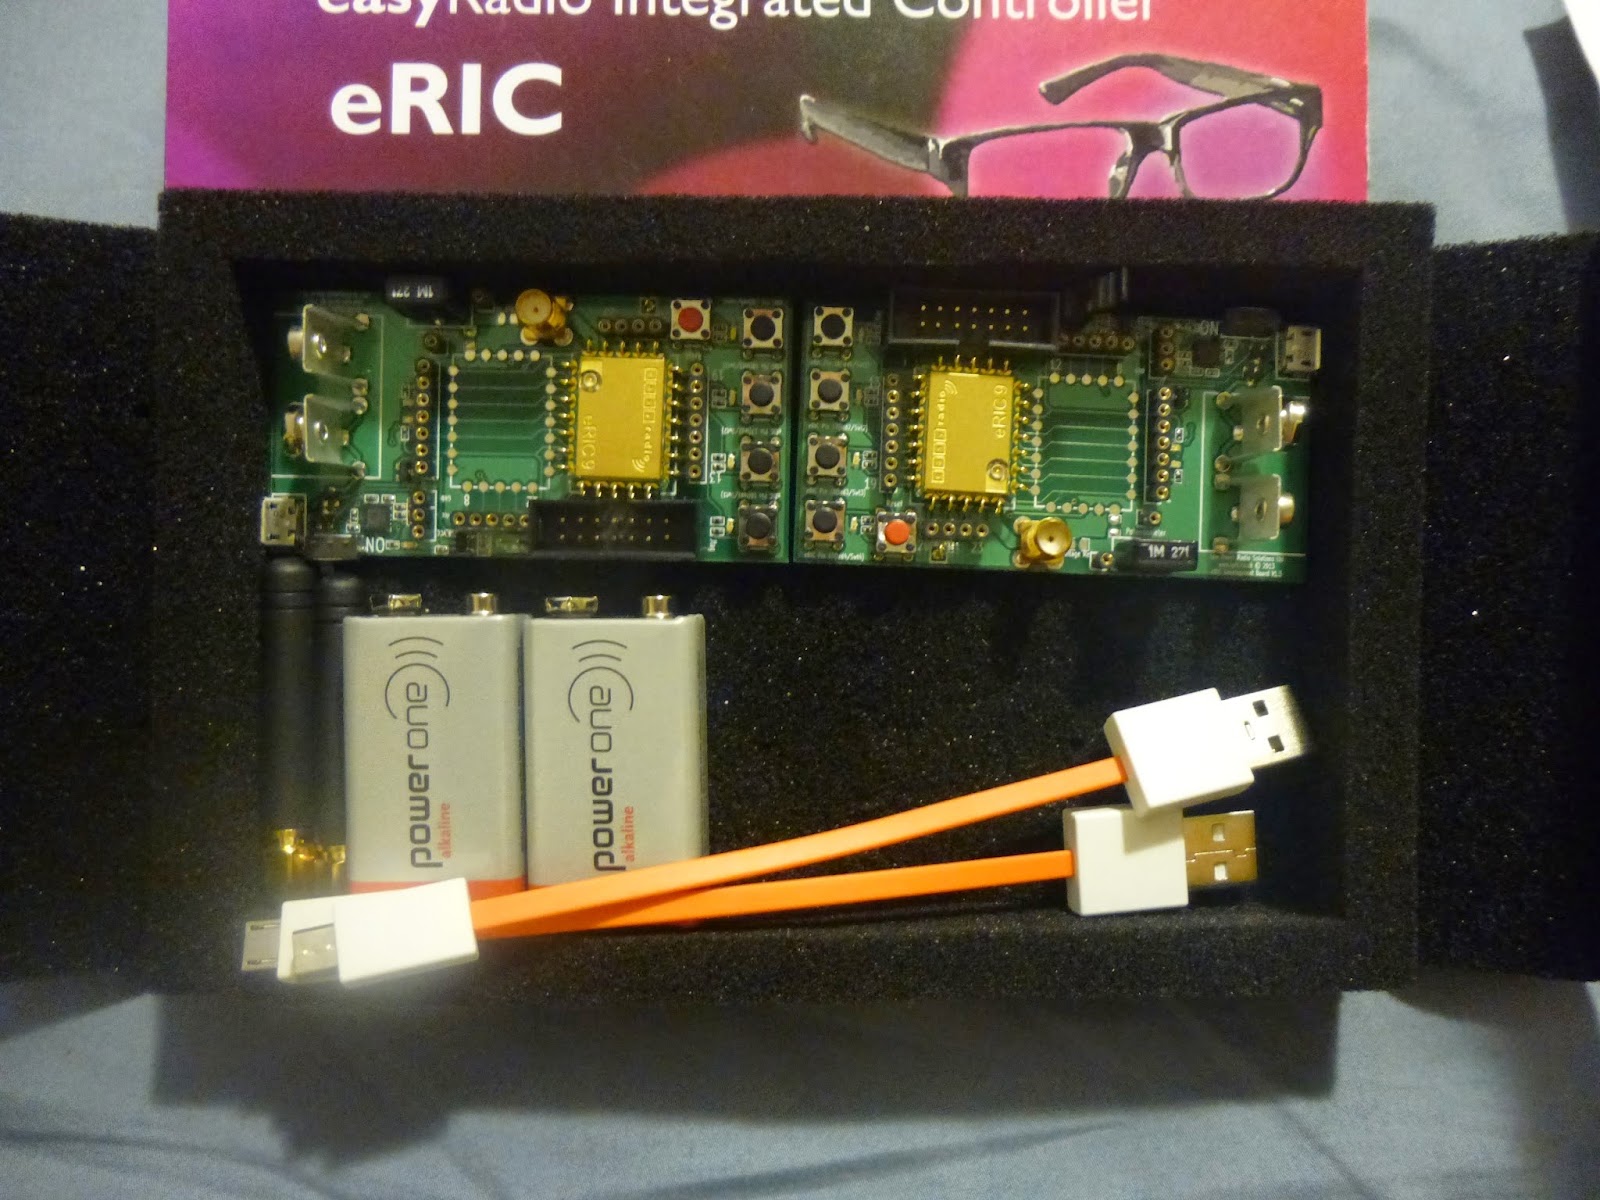
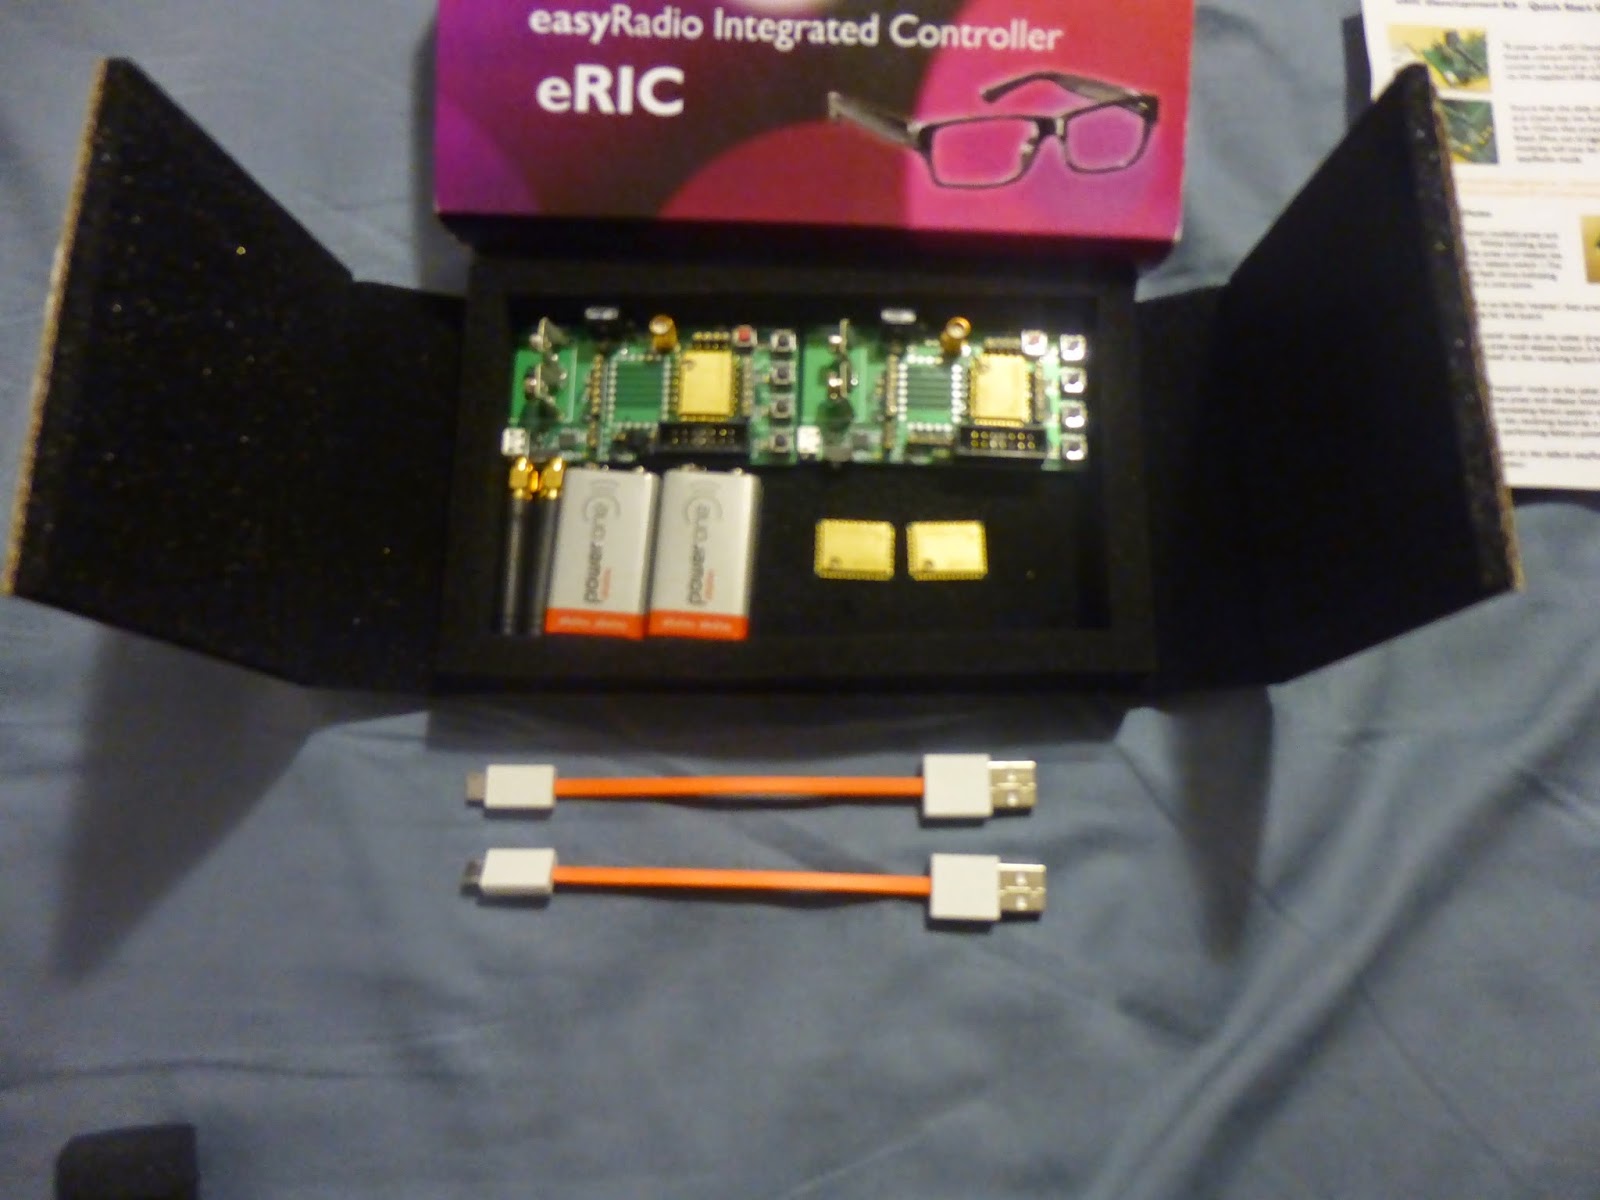
The packaging for these module was truly surprising. The box fits everything snuggly inside with almost no space to spare, this is a nice consideration as it allows for easy storage when the kit is no longer needed. The box is made from anti-static cardboard and anti-static foam. The kit contains two eRIC modules, two development boards, two antenna for the specified frequency (433/868/915 MHz),  two type A to Micro-B USB connectors, two 9V batteries and a Wireless Mike memory stick.

P1010206.JPGP1010208.JPG  p1010253.jpgp1010271.jpg
Figure 1. Opening the eRIC Development Kit and displaying the kits contents

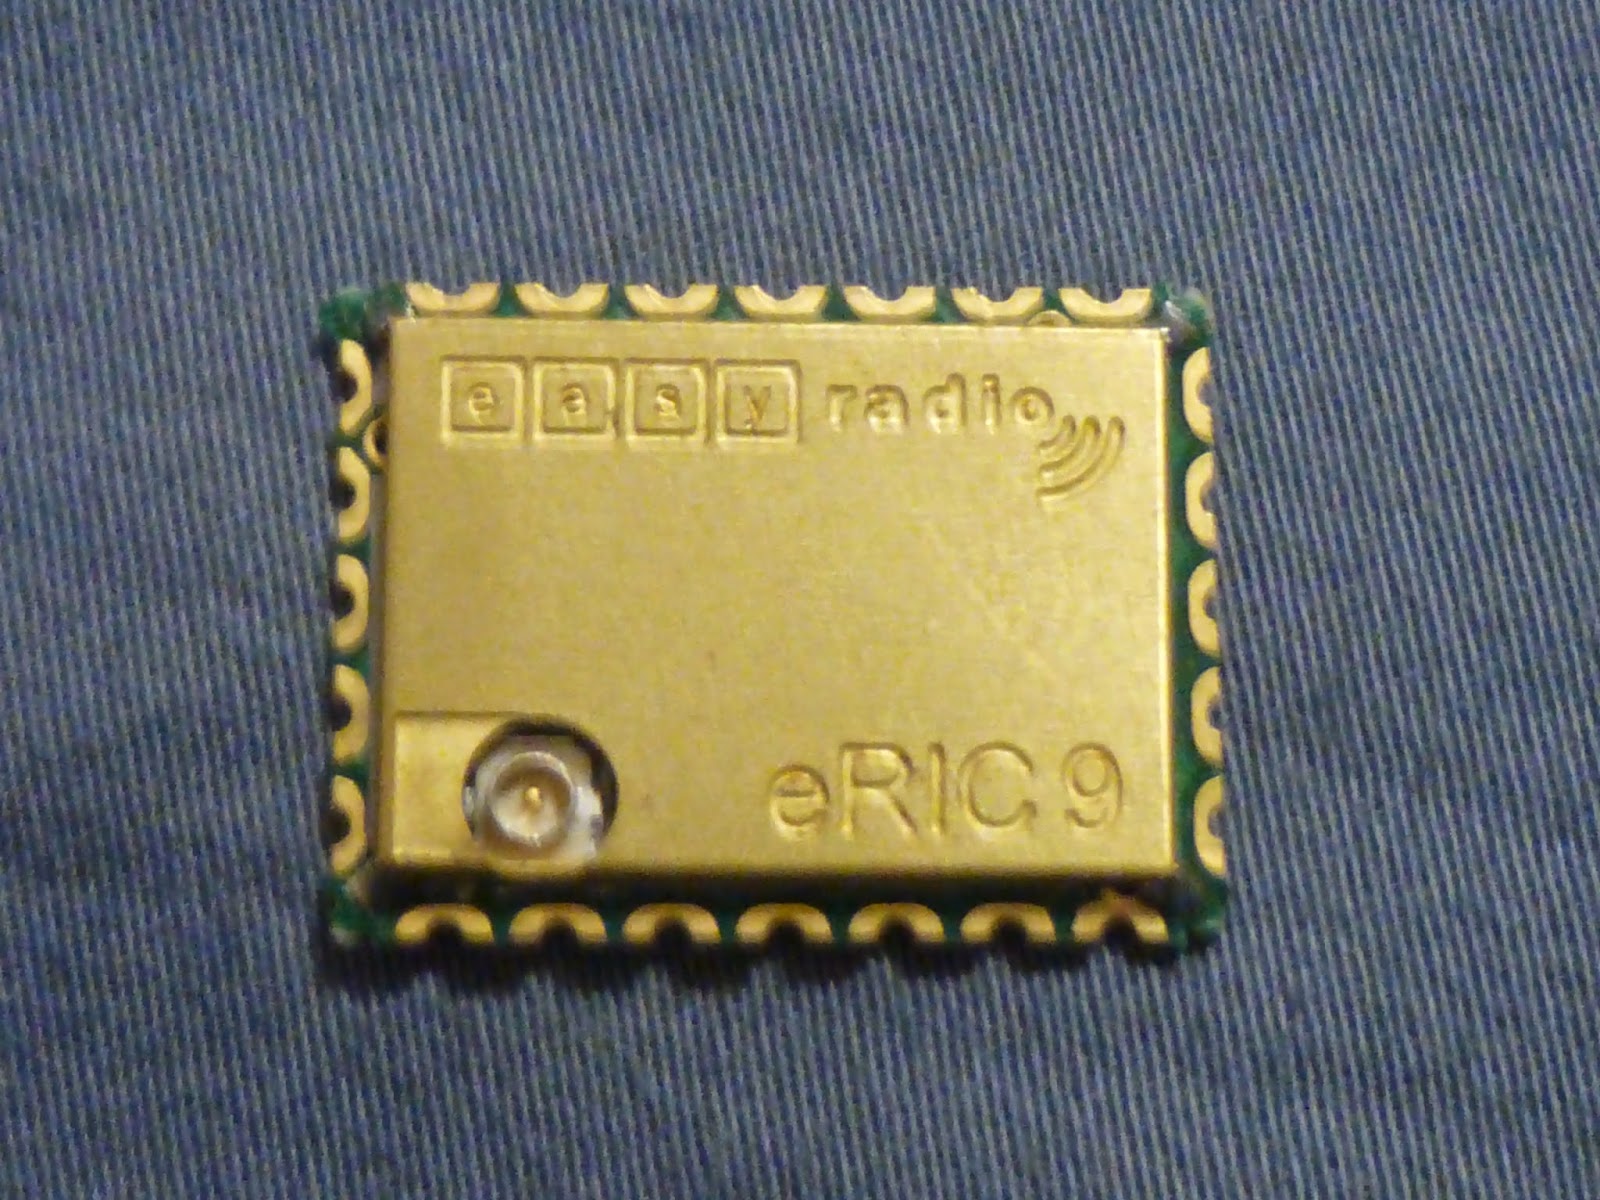
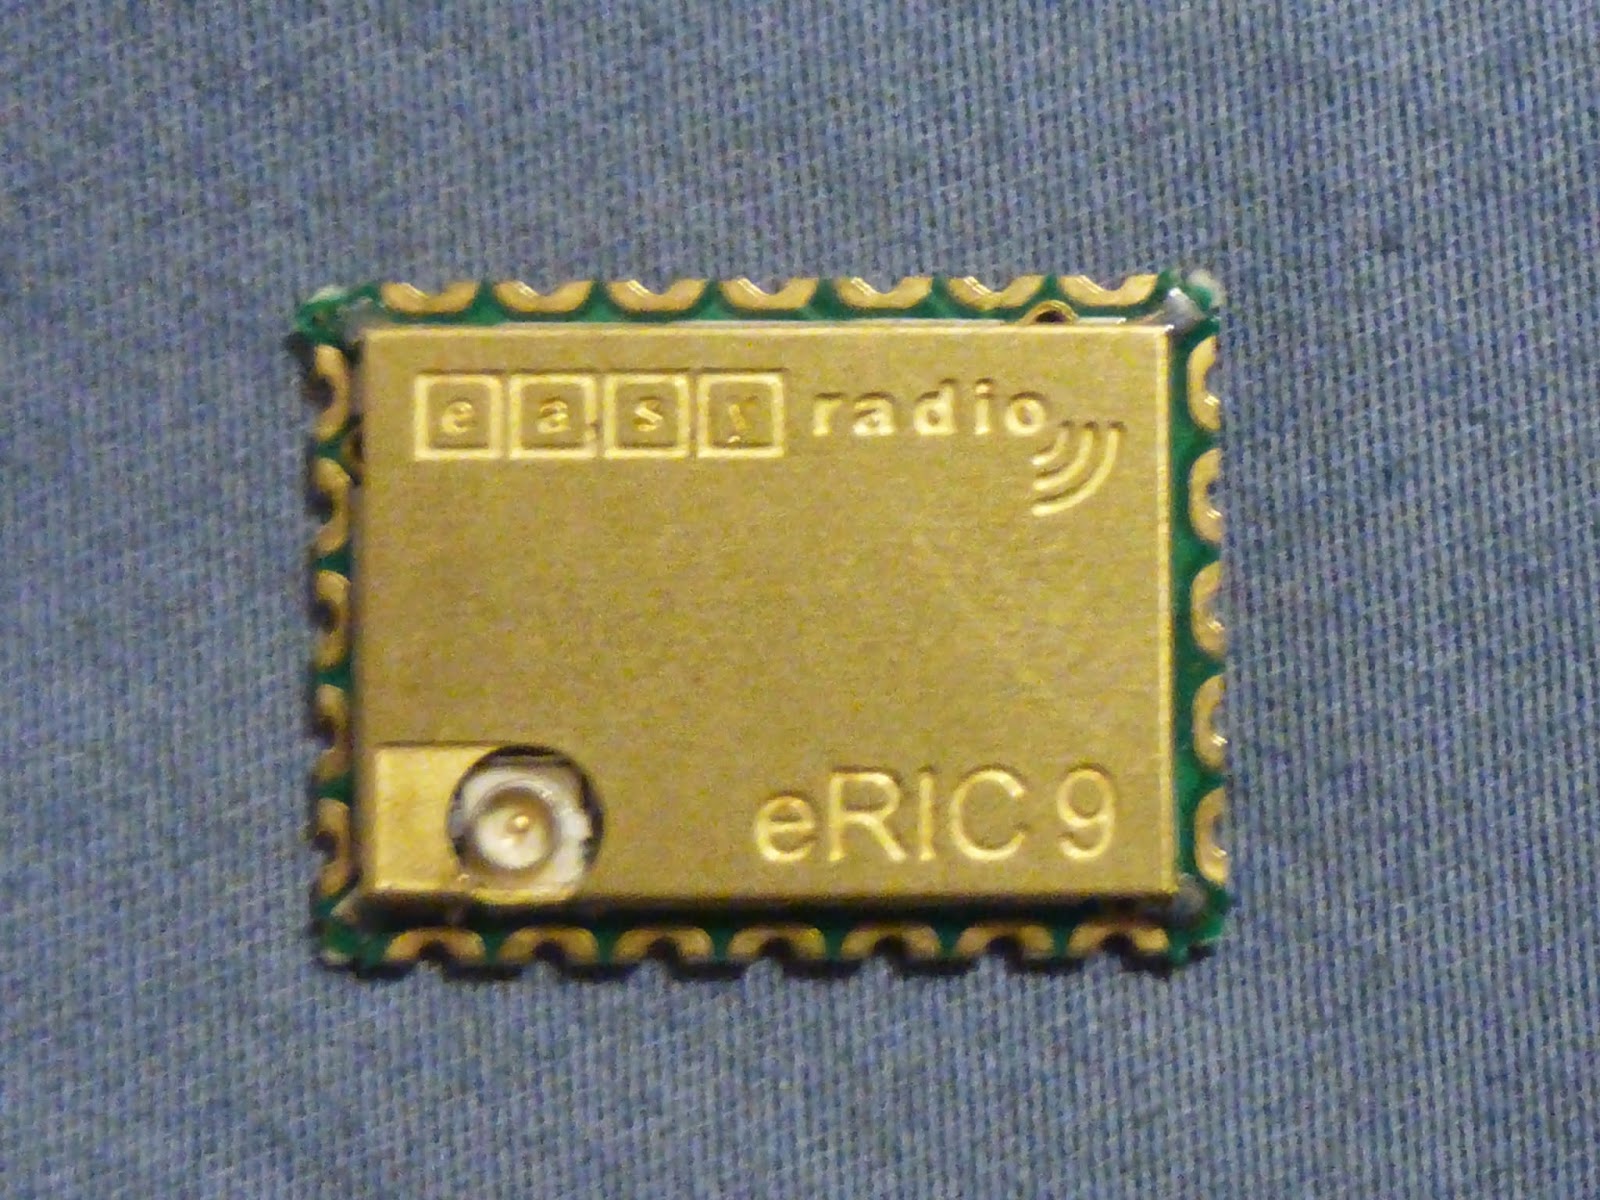
The models are location specific, this means that a different frequency is used depending on the country the modules are sent to. Europe models use 434 MHz while North America modules use 868/915 MHz. The modules are easily set apart by the markings on the individual module. The Europe modules have a “4” in the lower right corner while those for North America have a “9”, this can be seen in the picture below.
p1010262.jpgp1010267.jpg
Figure 2. eRIC module with a distinct “9” announcing its North American designation


First Impressions
After opening the kit it is a simple step to get the kit working to see what the kit is capable of. It is this step that gives the user there first impressions of the kit and modules and aid in deciding where to move forward with such a unit or not.

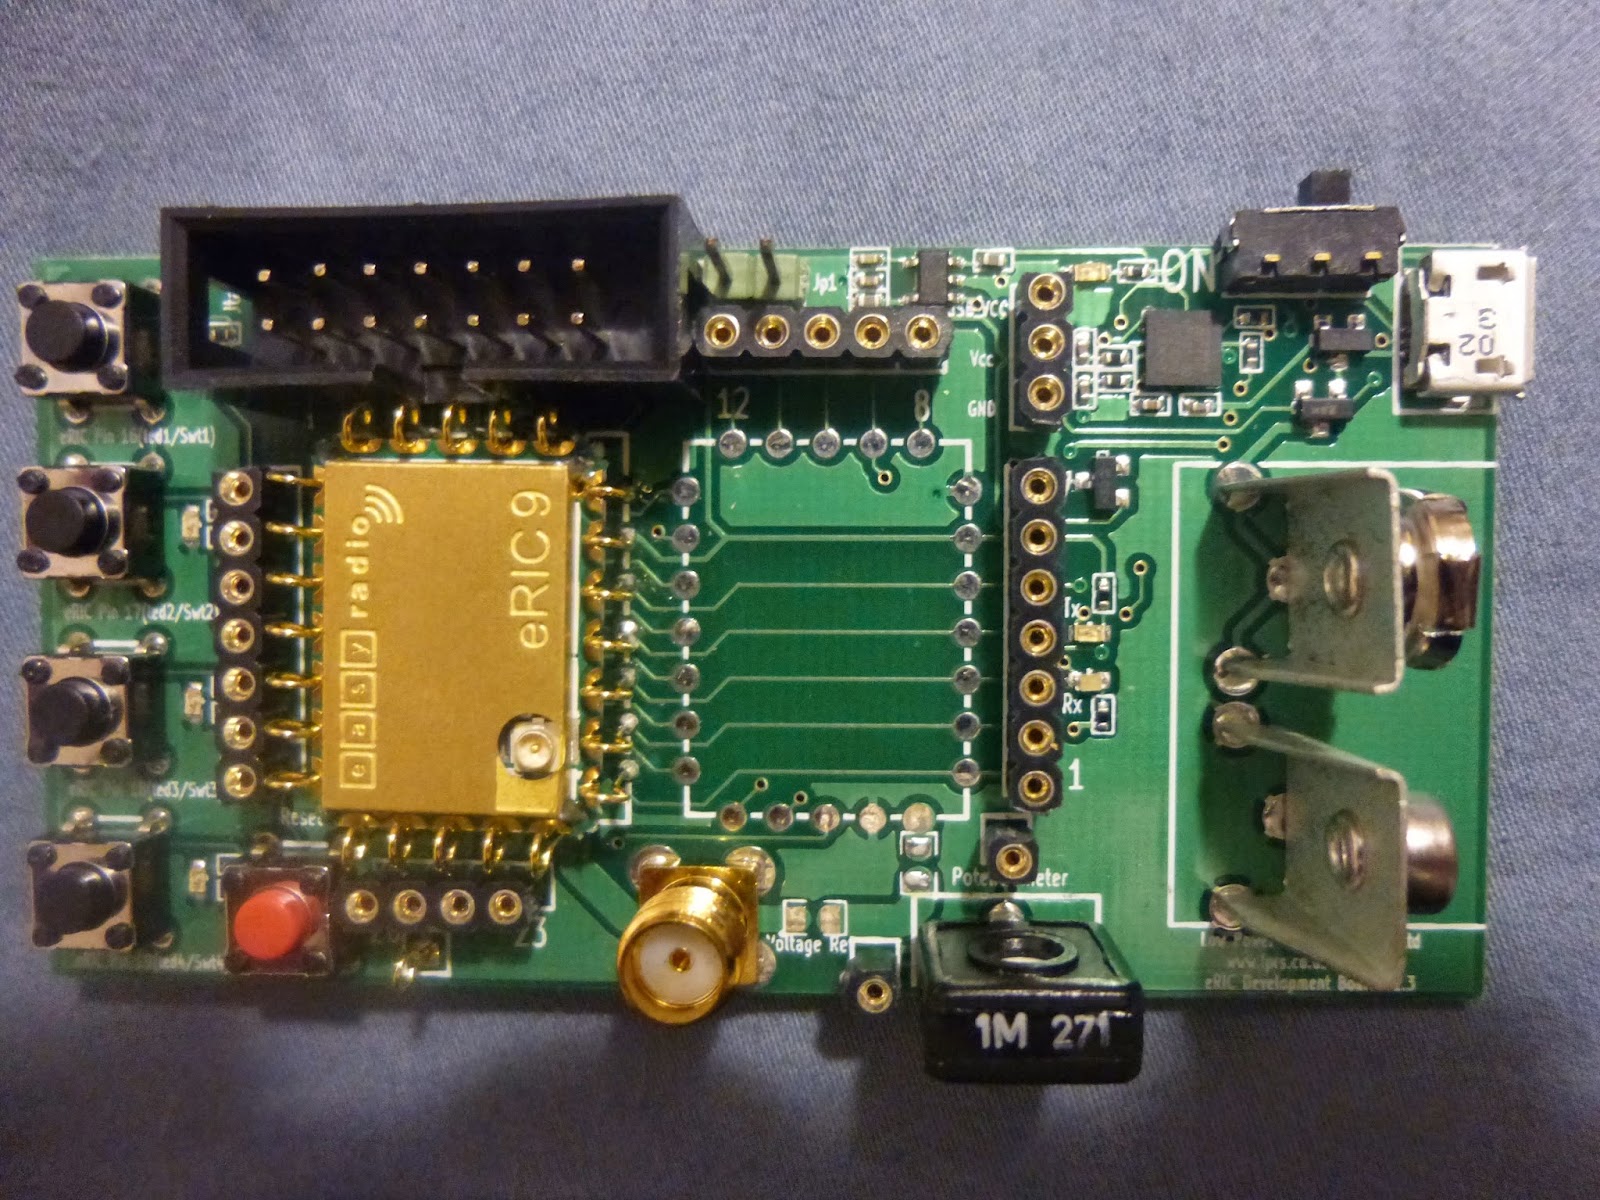
The onboard demo allows for either choosing a predefined flashing sequence or an echo of the button press of a tester. The predefined sequence is useful in quickly and simply determining the range the modules can handle. To get this demo working it is a matter of 3 button presses on each development board respectively. This is a simple and easy process, button #1 is pressed and held for 2 seconds, LED #3 & #4 will flash twice and then either button #2 (transmitter) or #4 (receiver) is pressed to choose the functionality that module is to take.
p1010256.jpg
Figure 3. Test buttons located on the left side

Hardware overview
Modules
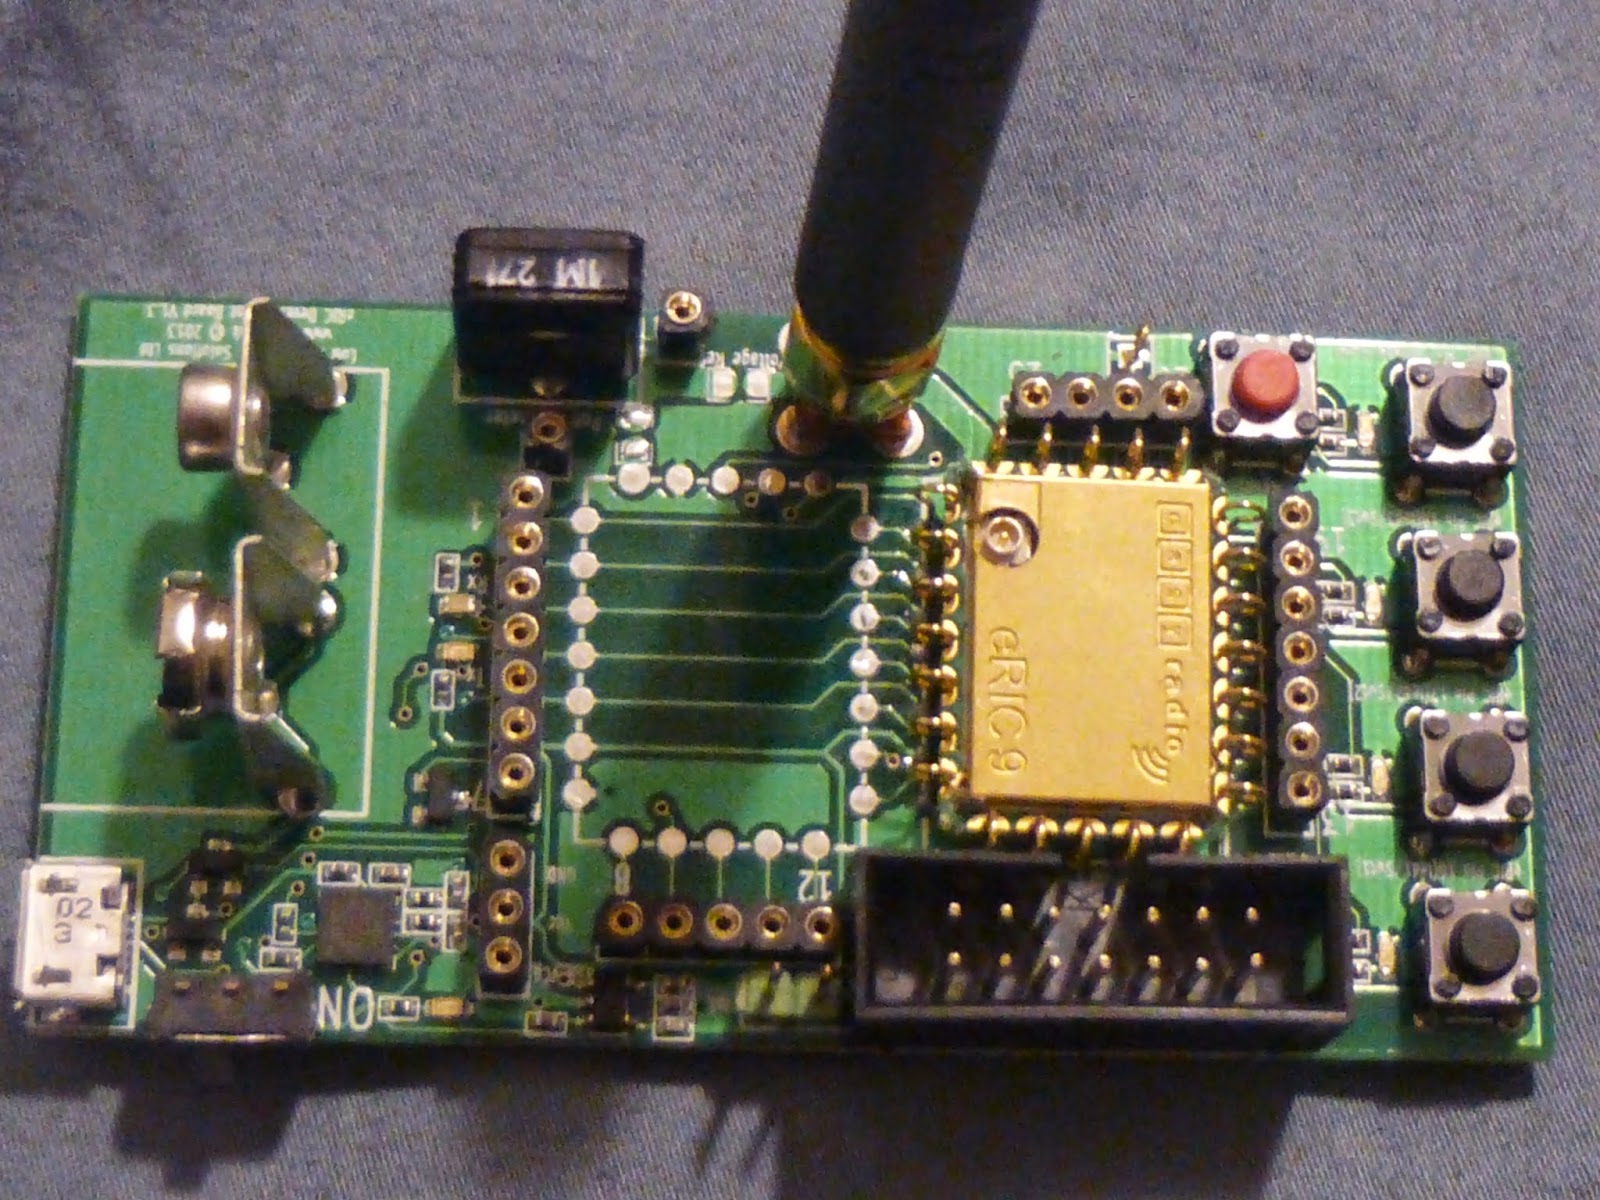
The eRIC modules are encased in a distinct gold plated RF shielding can with an opening for the u.fl connector and have 22 gold plated connection points. The connection points allow for the modules to be fully and easily used for a vast array of applications. The modules on the uC are also fully accessible allowing for high speed communication over SPI and I2C as well as lower speed communication over UART. There is also the ability to use the  GPIOs, ADCs and WDT all of this makes the eRIC an easy module to integrate into most projects. With 22 connection points at standard 0.1” pitch the module can easily be used with standard headers and breadboarded if needed. The different modules (North America vs. Europe) are easily distinguished from the number after the module’s eRIC marking.
p1010269.jpg
Figure 4. Development Kit with eRIC 9 module and Antenna (Battery not present)


Development Board
The modules fit easily and snugly into the development board and provides all necessary connections to the modules peripherals. The boards allow for a module to be soldered to the board or to use those pads as permanent test points. The development boards also provide a method to program the modules either through USB or through JTAG. There are 4 buttons to use for GPIO input and 4 LEDs for GPIO output allowing for crude debugging or program testing. Also included on the development board is an SMA connection for an external antenna. The antenna has been previously matched removing any need for set up by the end user. There is also a variable resistor for use with the modules accessible ADC. The on board battery connector allows for the development kit to work remotely and be a prototype substitute for a planned product.

The choice of battery is interesting due to its lower mAh (~500 mAh) compared to that of a AA battery (~1500 mAh). Considering the voltage regulators need to reduce the voltage from 9V to 3.3V instead of 4.5V to 3.3V the efficiency would definitely be lower. At the same time the use of a 9V battery allows for one battery to be used in a more compact form.  Since this is mainly for development this shorter run time would be acceptable.


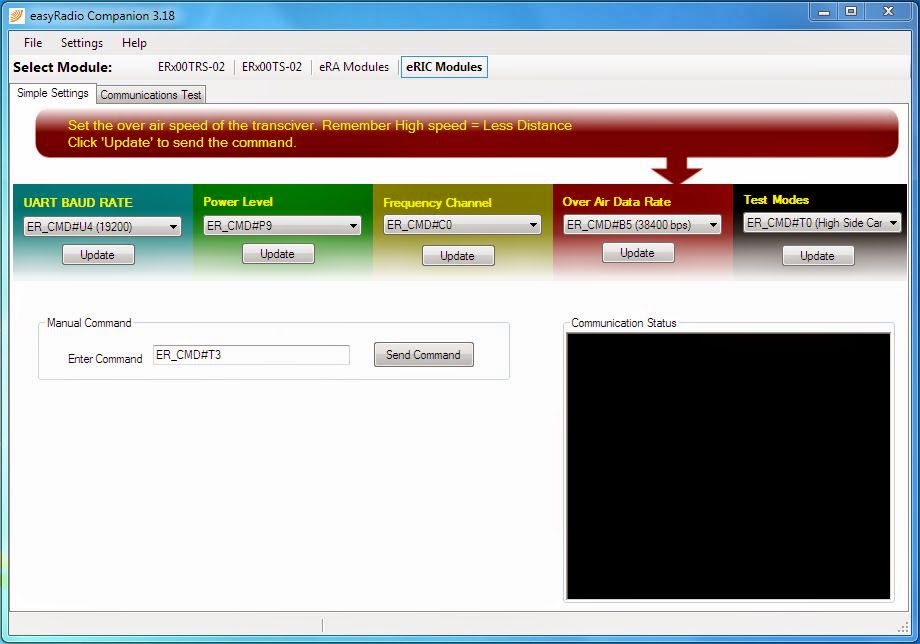
easyRadio companion software
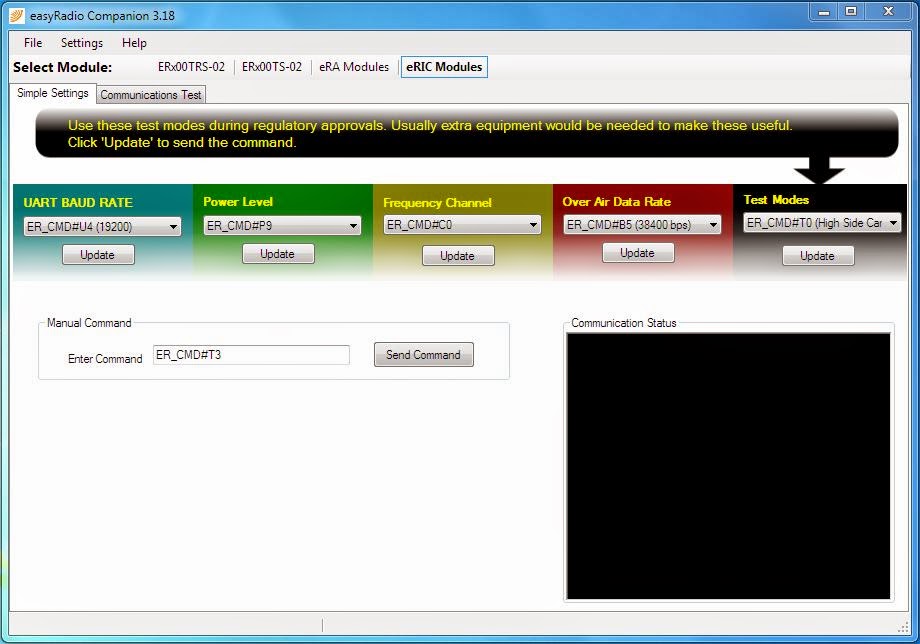
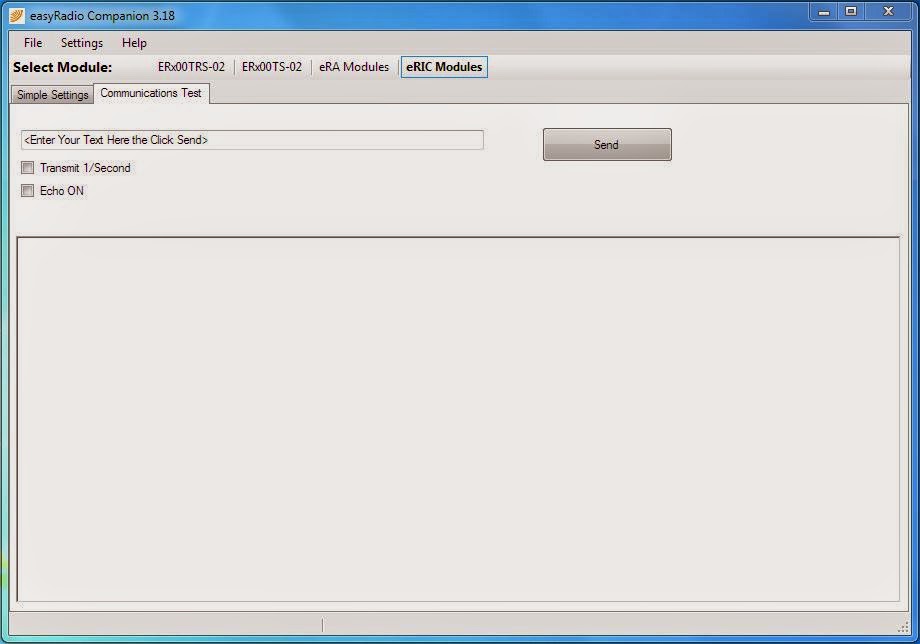
The kit comes with easy to use test software. The software includes easy configuration of all the basic modules wireless systems. These systems include UART baud rate, transmit power level, desired channel (frequency) as well as the over the air data rate. All of these settings allow for easy testing of the module in desired scenarios. This may include how the modules may interfere with or be disturbed by other systems, what is the optimal data rate so as not to lose data packets. Also included in the software is a test tab allowing for selecting high/low side and modulated carrier allowing for further testing of the RF signal with other systems. Also available in this tab is the ability to get the module version and the raw data being returned from the modules.
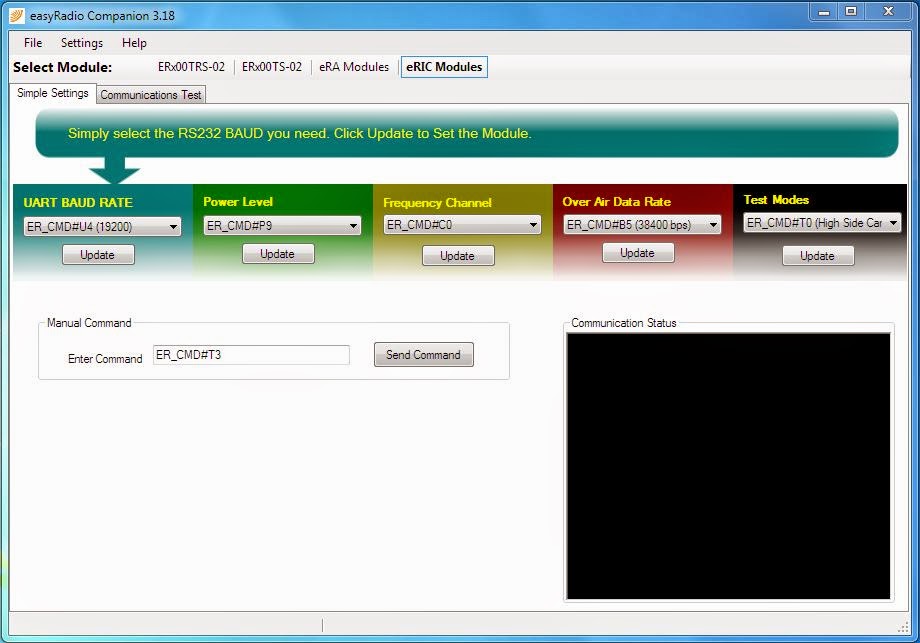
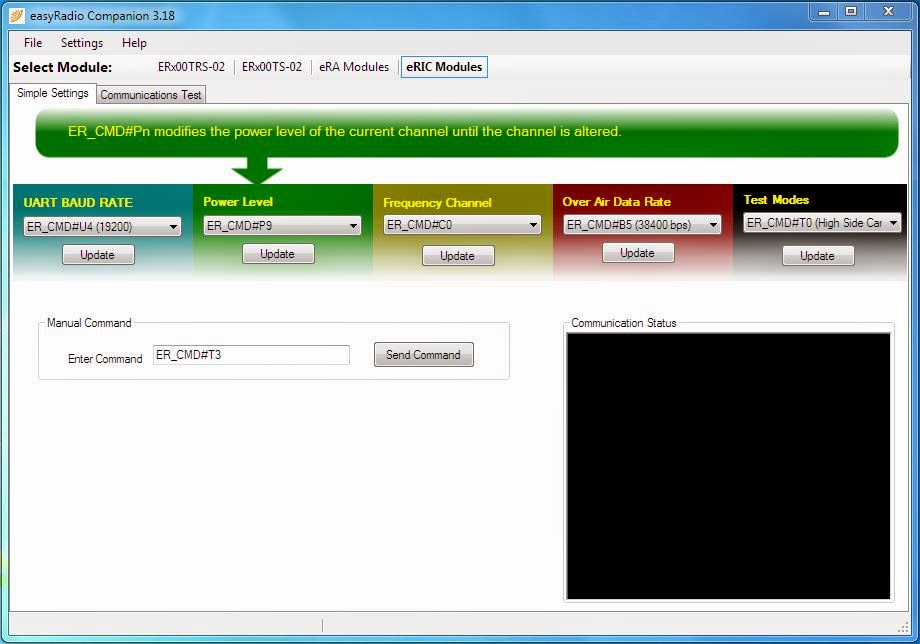
2014-11-18 01_04_21-Program Manager.jpg2014-11-18 01_06_09-Greenshot.jpg2014-11-18 01_05_39-Greenshot.jpg2014-11-18 01_06_26-Greenshot.jpg2014-11-18 01_06_41-Greenshot.jpg2014-11-18 01_07_16-Greenshot.jpg
Figure 5. The six screens viewable on the easyRadio Companion Software

The last tab allows for over the air transmission. This tab has an option for repeated sending at a rate of 1Hz as well a for a local echo. The one thing missing would be the ability to send large quantities of data in this test method so as to see what limits your unique situation encounter.

API
The modules come with what LPRS calls eROS (easyRadio operating system). This is a simple “operating system” to allow for a greater use of the modules subsystems. There is a large API (~100 functions) that allows for setting up the wireless, the UART, SPI, ADC, clock speed, interrupts etc. I have tested some of these calls and they seem to work with little issue, and it really helps to reduce the setup and prototyping stages.

The modules are coded using CCS from Texas Instruments and as this is not a foreign IDE there was little trouble using that as well. The code uses a predefined linker file as there is a bootloader on the modules that needs to be accommodated for. While this allows for security for LPRS’ code it makes coding slightly clumsy, its not a showstopper but it has some drawbacks. Over all the API it well defined, easy to follow and gives a lot of control of the module.


Range
Some basic testing was conducted with these units to see what type of range they have (a Spectrum analyzer would be awesome Element4… wink, wink). Since this is supposed to be a IoT module and presumably used for sensor networks there were two basic test done. The first was to place one unit  transmitting in one corner of a house while walking around with the second to determine when bits in the sequence where skipped. In a standard North American house both the the main floor as well as the basement where traversed with no missing bits in the sequence. The second test was a line of sight this was done by placing the unit first at shoulder height on a plastic stand and then on the ground transmitting. Again the second unit was receiving and was used to look for missing bits. The first test resulted in approximately 165 meters while the second test resulted in approximately 110 meters. While these numbers may seem small for the size and power consumption these are respectable numbers. Lastly both antennae were removed and as expected barely a meter out there was no longer any reception.

Comparison to CC3x00
As I have just completed a road test of the CC3x00 SimpleLink family it would be somewhat acceptable to compare at least the control of both products. For the most part the CC3x00s are a lot more complex and take longer to get up and running. Even with their added functionality they are more complex over all and harder to use than the eRIC modules. That being said both modules have their place in the IoT arena. For small sensor networks that could then relay information back to a single point the eRIC modules would be sufficient. However, for anything more complex I would suggest a CC3x00. Part of the reason for this is the lack of protocol on the eRIC modules. All communication is done via broadcast and therefore all addressing, message type would need to be implemented by the end user. While some will say this allows for flexibility it also can slow down some development.

Price point comparison vs features
For the price ($25) of these modules (not kits) they deliver a lot. They are easy to use, simple to set up and work out of the box. In comparison to the CC3100/CC3200 ($34/$23) they would be lacking a programer as at least one of them includes one and the other for an extra $15 it would be included. The eRIC kit on the other hand is $190 for a kit that only includes two modules any extra modules would need an antenna as well as a way to connect to the rest of your project, I’m not sure the extra $120 is worth it for the simplicity in the software.
Original post on Element14 can be found here

Wednesday, September 24, 2014

Sending Atmospheric Data from the MSP430 and CC3100 Wi-Fi BoosterPack to Plot.ly


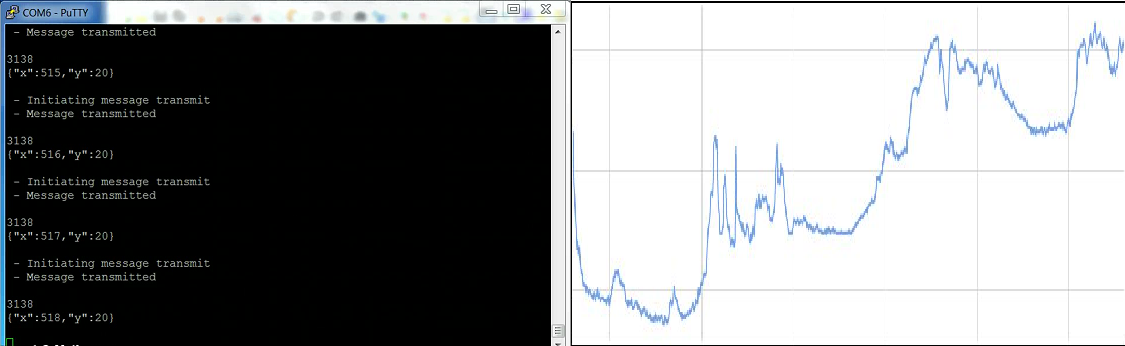
Figure 1. Terminal screen displaying live data being transmitted and demo Plot.ly graph

For a while now I have been thinking about the ability to remotely monitor what is going on environmentally in a location. I have thought about this with regards to the summer, with a cottage more than an hour away it would be nice to know what the weather pattern is for the cottages location (not the general city or county) to decide if it is worth the long drive. I have also thought about this with regards to parts of my house, such as the attic, basement etc, to help determine how well the insulation is working or what is going on in parts of the house where people may not often frequent. Lastly it has come up in many conversations with storekeepers who want to know how their fridges are performing and to know when there may be an issue. With all these usage cases I decided I should come up with a solution.

When TI came out with their CC3000 I thought I would give that a try. I spent a few weeks working with this BoosterPack in conjunction with a Stellaris (Tiva C) and MSP430G2553  launchpad but had a good few issues that just didn't seem easily resolvable as well as some limitations that hinder the usability of the system, besides by then TI had come out with the CC3100 that was supposed to resolve a lot of issues as well as be some what easier to use.
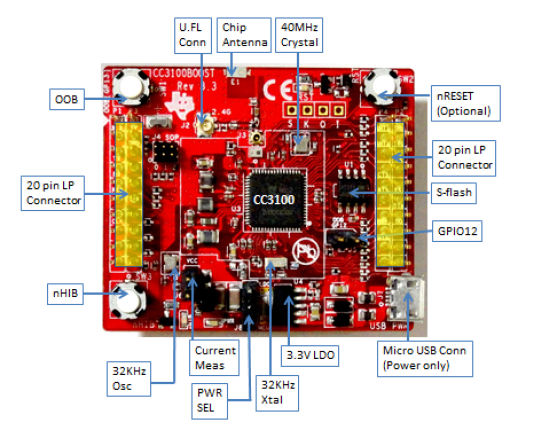
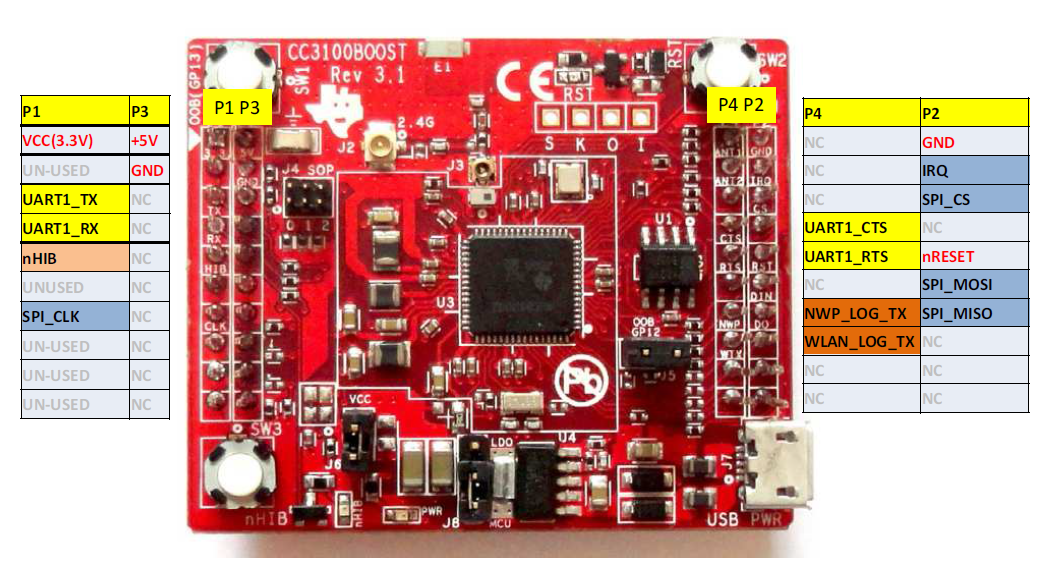
Figure 2. CC3100 layout and pin assignment

At the same time I was introduced to Plot.ly, an online graphing tool that allows for real time plotting of almost any form of data. After looking over how Plot.ly works I decided these two tools together would make a good start to resolving my real time remote data logging problem.

As I have a decent background with TI devices the use of TI products was a natural and convenient choice.The MSP430F5529LP was chosen as the brains behind the system and as previously stated the CC3100  was chosen for the Wi-Fi connection. The MSP430F5529LP was chosen do to the wide availability of example code and wide usage of this launchpad with the CC3100.
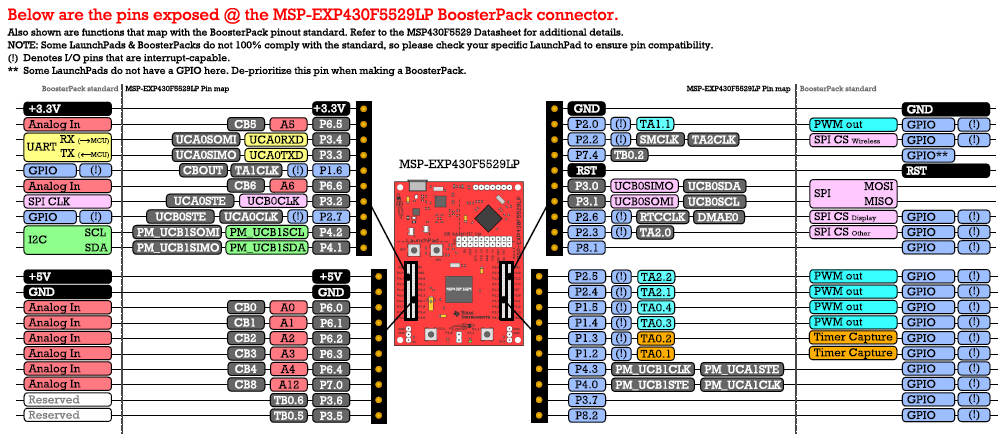
MSP-EXP430F5529LP_QSG_PinOut.png
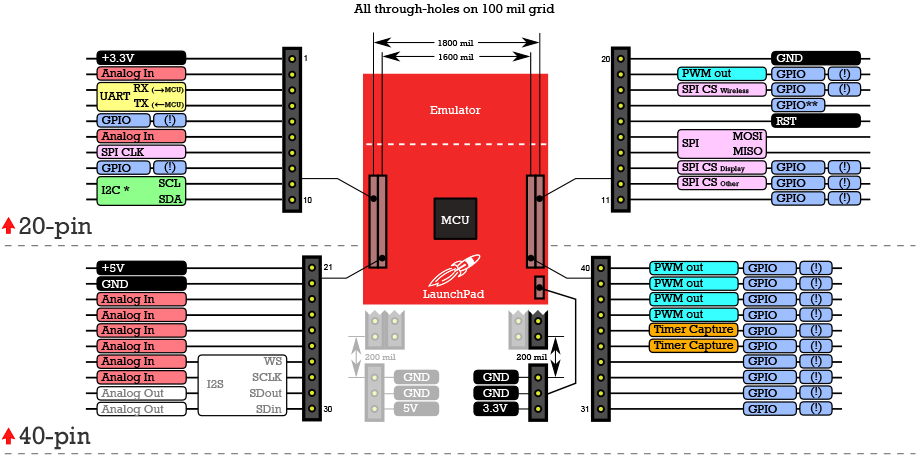
Figure 3. MSP430F5529 pin assignment for use with BoosterPacks

The Wi-Fi connection is a CC3100 Boosterpack that contains an integrated TCP stack and is interacted via SPI. One of the important features about this BoosterPack is its conformity to the BYOB (build your own board) standards.

Figure 4. Build Your Own Board pin assignment layout

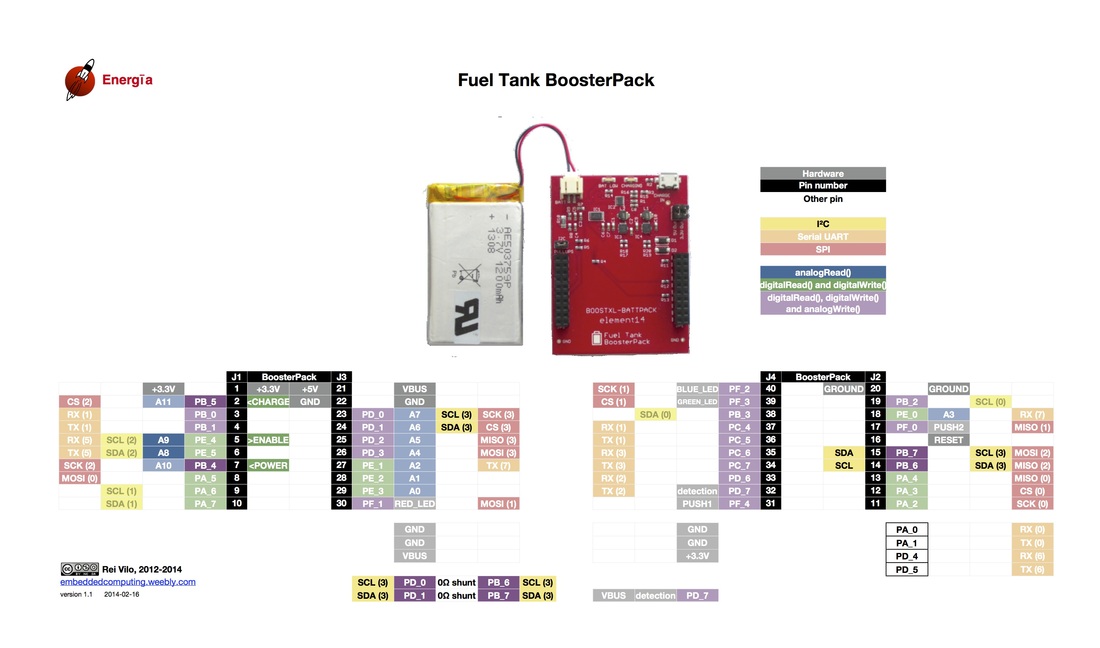
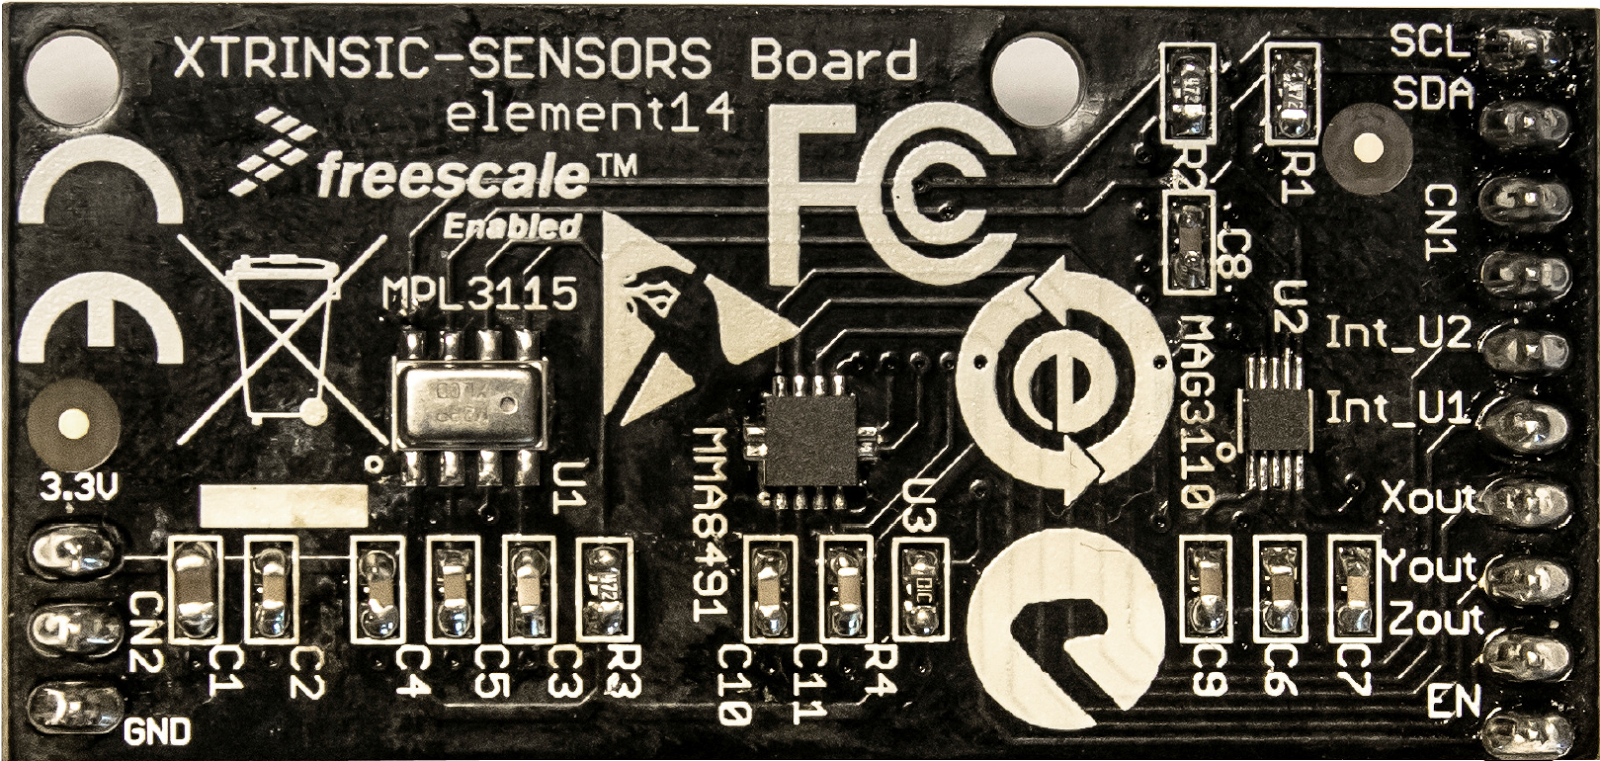
This means that all the pin connections are in predetermined locations allowing for ease of use with other BoosterPacks. The sensor chosen is a MPL3115A pressure sensor from Freescale and was integrated using the Xtrinsic sensor board from Element14 and Freescale. Lastly as this needs to be able to work in a remote location I decided to add a local power source, for this the Fuel Tank BoosterPack from Element14 was chosen. This choice however does present its own issue. The Fuel Tank BoosterPack does not conform to the BYOB standard. With some connections in contention this board was connected via jumper leads and for now only provides power, the power monitoring ability of the BoosterPack has not been implemented but hopefully will be in a later iteration of this project.


Figure 5. Fuel Tank BoosterPack pin assignment (non-conforming)


The project is based on the TCP_Socket demo for the CC3100. This demo has the basics needed to connect to an access point (AP), open a socket and send data, this provides a very substantial start for the project. This code was modified one step at a time. The first step was to allow for data of my choosing to be transmitted. This was tested and verified using a piece of software from HW-Group called Hercules. This software allows you to have a server running on your PC and to easily receive and see incoming data. One this was done the code needed to be further modified to allow for one connection to be made and multiple packets of data to be transmitted. This was done by splitting the BSDclient function into two distinct functions. The first function would take care of creating a socket and connecting to it. The second function packetTx would then take care of transmitting the desired data. Once this was done (with some difficulty, see forum posts for details), it was time to start transmitting data to Plot.ly.

The website for Plot.ly origanly did not provide a lot information if you were not using one of there standard platforms (Arduino, Matlab, etc) or one of there chosen languages (Python, R, Arduino), I therefore had to take the Arduino code (the easiest to understand) and parse it so it could be used in the format needed by the CC3100. From this code (Plotly’s Arduino code) I was able to create a graph using the REST API commands. These commands in their most basic form look like this:

POST /clientresp HTTP/1.1
Host: 107.21.214.199
User-Agent: MSP430F5529/0.5.1
Content-Length: 243
where the IP address “107.21.214.199” is the address of Plot.ly. The content length is the length of the following string in bytes that actually creates the graph (Note each line is terminated with a carriage return as well as a new line (“\r\n”)):

version=2.2&origin=plot&platform=Stellaris&un=Kas&key=ABCDEFGHI&args=[{"y": [], "x": [], "type": "scatter", "stream": {"token": "1234567890", "maxpoints": 500}}]&kwargs={"fileopt": "overwrite", "filename": "test plot", "world_readable": true}

I will explain this string briefly. Platform is the platform or language being used, from what I can tell changing this has no effect on how the graph behaves. “un” is the username, mine is Kas. “key” is your unique identifier key that allows access to your account. “args” is used to set up the individual traces, in this case I have only one trace so there is only one set of args. if you wanted more than one trace you would use something like this:

version=2.2&origin=plot&platform=MSP430F5529&un=Kas&key=ABCDEFGHI

&args=[{"y": [],"x": [],"name": "Temperature","type": "scatter", "stream": {"token": "1234567890", "maxpoints": 500},"yaxis":"y1"}, {"y": [],"x": [],"name": "Pressure","type": "scatter", "stream": {"token": "1a2b3c4d5e", "maxpoints": 500}, "yaxis": "y2"}]

&kwargs={"filename": "Temperature and Pressure", "fileopt": "overwrite", "style": {"type": "scatter"}, "layout": {"title": "Temperature and Pressure vs. Time", "xaxis": {"title": "Time (s)"}, "yaxis": {"title": "Temperature (Celsius)"}, "yaxis2": {"title": "Pressure"}}, "world_readable": true}


for a full listing of commands you can look at this documentation. “kwargs” is the settings for the overall graph such as the title, public/private access as well as others. At this point I had a graph created and was able to see it in my workspace on the Plot.ly website. I now needed to stream data, using the Arduino code for this however did not appear to help very much. I will again show the commands to open a stream and stream data and then explain them.

POST / HTTP/1.1
Host: stream.plot.ly
User-Agent: Python
Transfer-Encoding: chunked
Connection: keep-alive
plotly-streamtoken: 1234567890

In this code the main command that you need to edit is “plotly-streamtoken”. This line is used to specify the specific trace that this data should be posted to, it is the same as the token in the args passed to create the graph. Note each line is terminated with a carriage return as well as a new line (“\r\n”). Once the stream is open data can be sent to tos graph and trace specified this is done by the following line:

3134
{"x":1,"y":5}
3134
{"x":2,"y":5}

This is where it gets confusing, the 3135 appears to be meaningless but is is infact hex for 14. There are 14 bytes transmitted here including a new line. The “X” value here can be seen to be 1, 2 and the “Y” value is 5. The order of the “X” and ”Y” does not appear to matter. Data must be transmitted once per minute or Plot.ly closes the stream, you can choose to reopen the stream (Plot.ly would prefer you don’t consttly open and close sockets) or preferably send a heartbeat (“\r\n”) if it will be longer then a minute before your next data transmission. Now that we can open a connection with Plot.ly using the CC3100, stream data to plot in reat time its time to get the data from the desired sensor.

I chose to use the MPL3115A as it is a relatively simple sensor to use and I had one laying around. The MPL3115A uses I2C to communicate and once set up to take a reading every second there is not much to do other than poll for data. This will eventually be changed to an interrupt based system which would ideally allow for the MSP430F5529LP to sleep for approximately 95% of the time (back of the envelope calculation) increasing the units life by orders of magnitude.

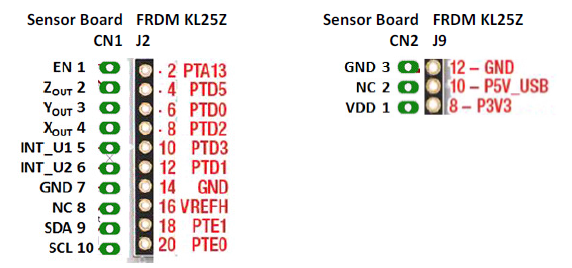
Figure 6. Xtrinsic Sensor Board and pin assignment configuration

This code was initially developed separately from the TCP_Socket code and was slowly merged allowing for issues to be easily resolved. The main issue encountered was the “Error: "Program will not fit into" after adding interrupt handler” this was eventually resolved by simply removing the interrupt handler for “USCI_B1_ISR” in board.c. Once the data is read in it needs to be changed to a string and assembeled as message that Plot.ly can interpret. This is all done in the “plotlyPlotString” function, two integers are passed in as well as a pointer to a char array. The integers are converted to chars and inserted into the string ready to be sent to Plot.ly (this function in its entierty can be confusing so if anyone would like more clarification I would be happy to further exlpain it below). One integrated and tested the system performed pretty well.

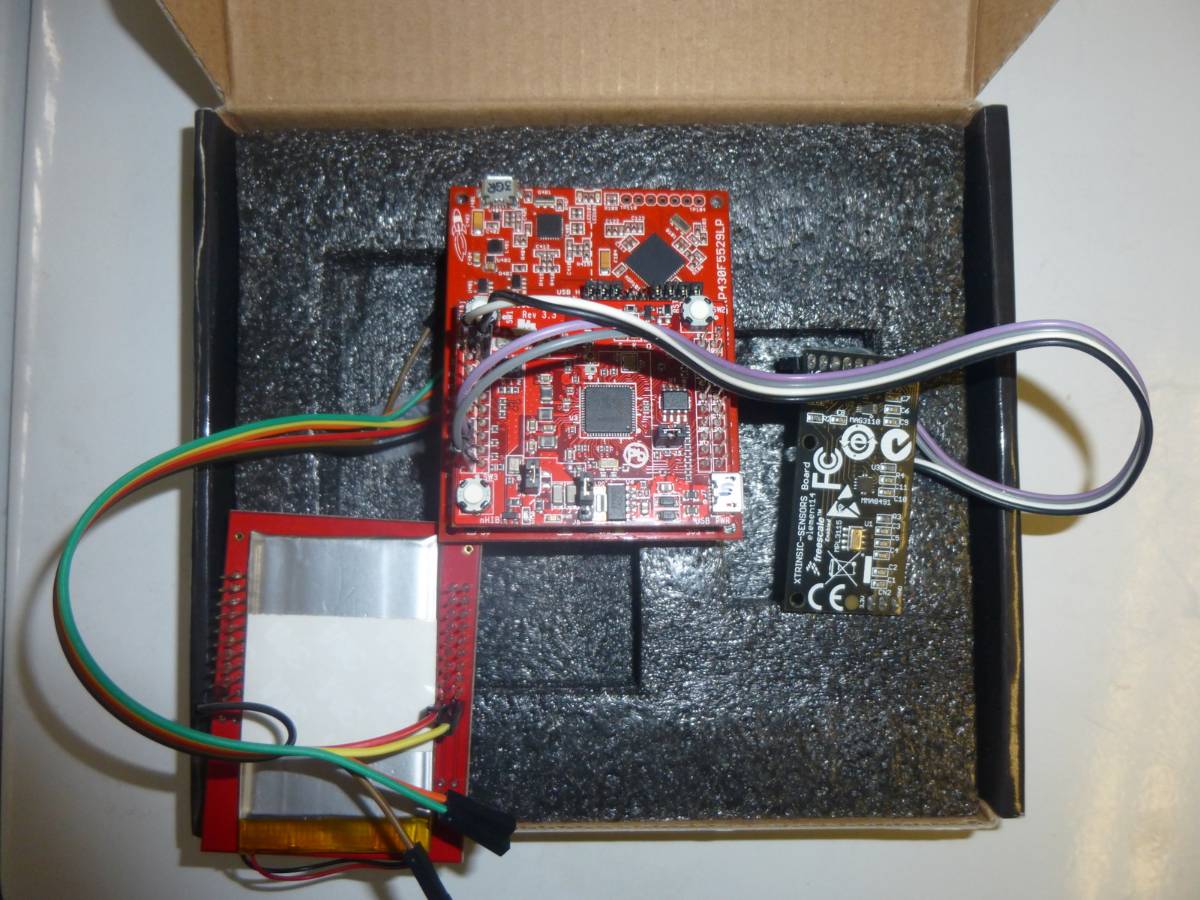
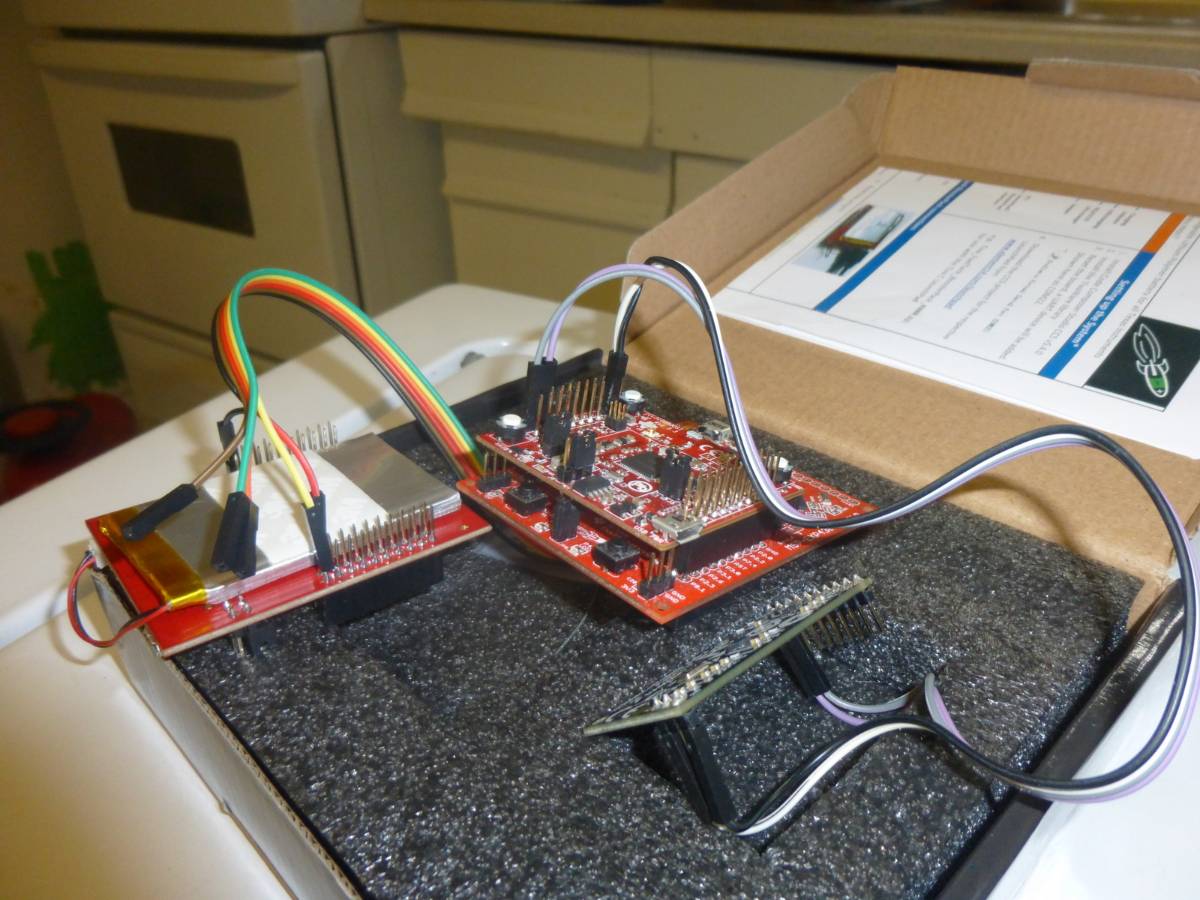
P1010197.JPGP1010203.JPGFigure 7. MSP430F5529 with CC3100 BoosterPack mounted and connected to the Xtrinsic Sensor Board (P4.1, P4.2) and Fuel Tank BoosterPack (3.3V, 5V, GND)

Next Steps
Moving forward there are a number of improvements that need to be made. As of now the system disconnects from Plot.ly after ~530 data points (this does not happen with the Hercules server), this issue will need to be resolved and is currently under further investigation. There is also the issue of inadvertent disconnections from the AP that for a robust system will need to be taken care of, this will involve checking that the connection has not been closed and if it has, to reconnect. There is also the need to check that the socket has not been closed and again if it has to reopen it before continuing to send data. Lastly for complete robutness the system should be able to check for error messages from Plot.ly and react to them in a meanigfull manour.

Besides for these steps the inclusion of pressure data on a separate “Y” axis would allow for a better use of the chosen sensor. Also the full implementation of the Fuel Tank BoosterPack with power monitoring and plotting time remaining, battery voltage and possibly other metrics would be a useful addition.

I will update this post as the project evolves. If you have any questions or comments I would be happy to address them in the comments below.

For those who would like to try this and may run into the same issues I have, I have included a link to the issues I had and how TI helped me resolve each of them

CC3100


Original post on Element14 can be found here